Immigrants from North America vs Immigrants from Ecuador GED/Equivalency
COMPARE
Immigrants from North America
Immigrants from Ecuador
GED/Equivalency
GED/Equivalency Comparison
Immigrants from North America
Immigrants from Ecuador
87.8%
GED/EQUIVALENCY
99.1/ 100
METRIC RATING
65th/ 347
METRIC RANK
81.0%
GED/EQUIVALENCY
0.0/ 100
METRIC RATING
309th/ 347
METRIC RANK
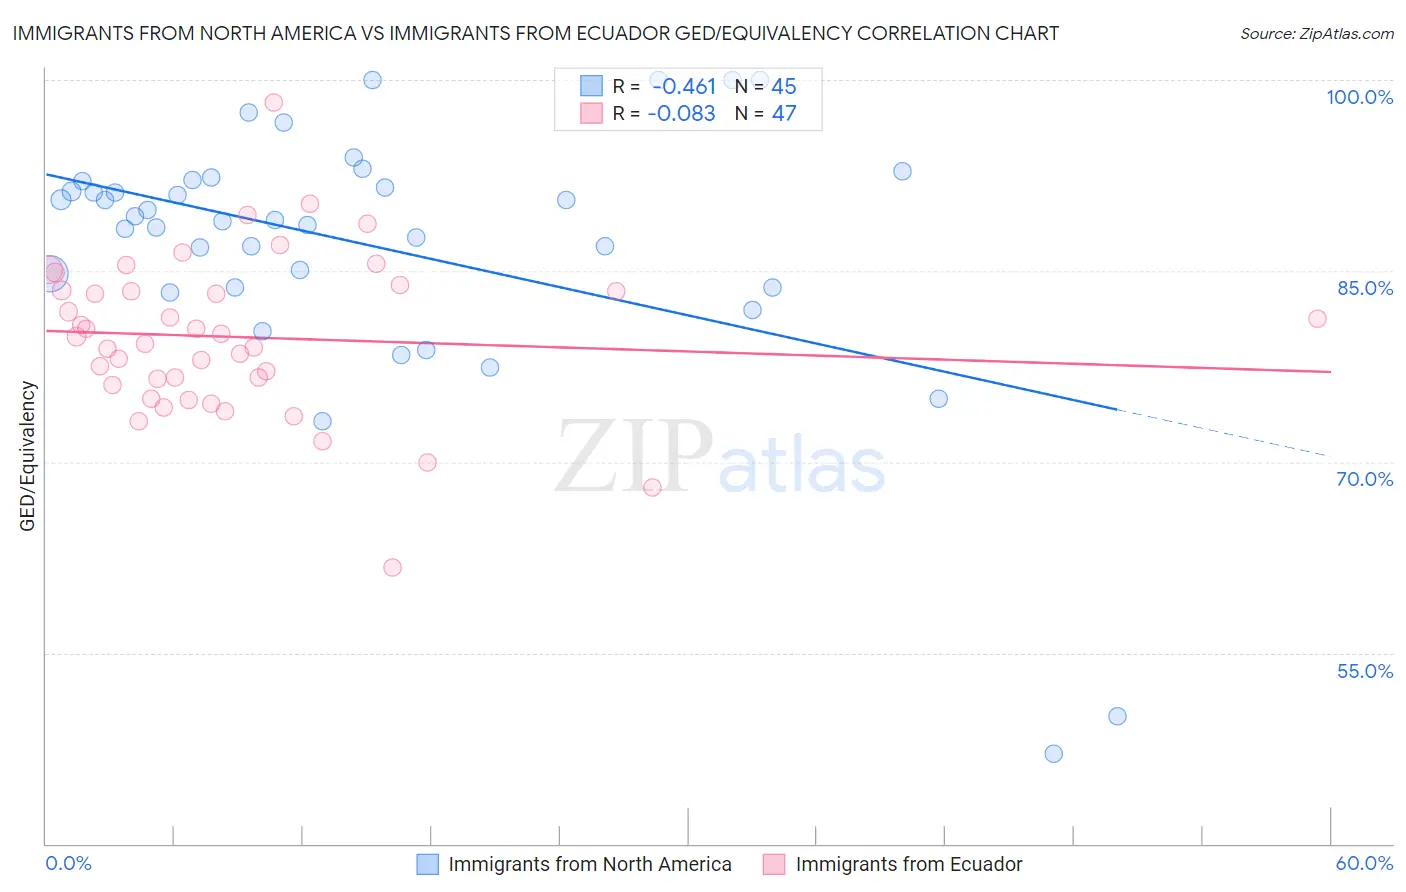
Immigrants from North America vs Immigrants from Ecuador GED/Equivalency Correlation Chart
The statistical analysis conducted on geographies consisting of 462,461,910 people shows a moderate negative correlation between the proportion of Immigrants from North America and percentage of population with at least ged/equivalency education in the United States with a correlation coefficient (R) of -0.461 and weighted average of 87.8%. Similarly, the statistical analysis conducted on geographies consisting of 271,020,679 people shows a slight negative correlation between the proportion of Immigrants from Ecuador and percentage of population with at least ged/equivalency education in the United States with a correlation coefficient (R) of -0.083 and weighted average of 81.0%, a difference of 8.4%.
GED/Equivalency Correlation Summary
| Measurement | Immigrants from North America | Immigrants from Ecuador |
| Minimum | 47.1% | 61.7% |
| Maximum | 100.0% | 98.2% |
| Range | 52.9% | 36.5% |
| Mean | 86.9% | 79.8% |
| Median | 89.0% | 79.8% |
| Interquartile 25% (IQ1) | 83.7% | 76.0% |
| Interquartile 75% (IQ3) | 92.1% | 83.5% |
| Interquartile Range (IQR) | 8.4% | 7.5% |
| Standard Deviation (Sample) | 10.5% | 6.3% |
| Standard Deviation (Population) | 10.4% | 6.3% |
Similar Demographics by GED/Equivalency
Demographics Similar to Immigrants from North America by GED/Equivalency
In terms of ged/equivalency, the demographic groups most similar to Immigrants from North America are Immigrants from Bulgaria (87.8%, a difference of 0.0%), British (87.8%, a difference of 0.010%), Immigrants from France (87.8%, a difference of 0.020%), Immigrants from Canada (87.9%, a difference of 0.030%), and Immigrants from Turkey (87.9%, a difference of 0.070%).
| Demographics | Rating | Rank | GED/Equivalency |
| Northern Europeans | 99.3 /100 | #58 | Exceptional 87.9% |
| Serbians | 99.3 /100 | #59 | Exceptional 87.9% |
| Scandinavians | 99.3 /100 | #60 | Exceptional 87.9% |
| Europeans | 99.3 /100 | #61 | Exceptional 87.9% |
| Germans | 99.3 /100 | #62 | Exceptional 87.9% |
| Immigrants | Turkey | 99.2 /100 | #63 | Exceptional 87.9% |
| Immigrants | Canada | 99.2 /100 | #64 | Exceptional 87.9% |
| Immigrants | North America | 99.1 /100 | #65 | Exceptional 87.8% |
| Immigrants | Bulgaria | 99.1 /100 | #66 | Exceptional 87.8% |
| British | 99.1 /100 | #67 | Exceptional 87.8% |
| Immigrants | France | 99.1 /100 | #68 | Exceptional 87.8% |
| Immigrants | Saudi Arabia | 99.0 /100 | #69 | Exceptional 87.8% |
| Ukrainians | 98.8 /100 | #70 | Exceptional 87.7% |
| Austrians | 98.8 /100 | #71 | Exceptional 87.7% |
| Immigrants | Moldova | 98.8 /100 | #72 | Exceptional 87.7% |
Demographics Similar to Immigrants from Ecuador by GED/Equivalency
In terms of ged/equivalency, the demographic groups most similar to Immigrants from Ecuador are Immigrants from Guyana (81.0%, a difference of 0.060%), Native/Alaskan (80.9%, a difference of 0.070%), Puerto Rican (81.1%, a difference of 0.080%), Nicaraguan (80.9%, a difference of 0.10%), and Cape Verdean (80.9%, a difference of 0.10%).
| Demographics | Rating | Rank | GED/Equivalency |
| Immigrants | Haiti | 0.0 /100 | #302 | Tragic 81.6% |
| Immigrants | Portugal | 0.0 /100 | #303 | Tragic 81.6% |
| Navajo | 0.0 /100 | #304 | Tragic 81.5% |
| Immigrants | Grenada | 0.0 /100 | #305 | Tragic 81.3% |
| Guyanese | 0.0 /100 | #306 | Tragic 81.3% |
| Immigrants | Dominica | 0.0 /100 | #307 | Tragic 81.1% |
| Puerto Ricans | 0.0 /100 | #308 | Tragic 81.1% |
| Immigrants | Ecuador | 0.0 /100 | #309 | Tragic 81.0% |
| Immigrants | Guyana | 0.0 /100 | #310 | Tragic 81.0% |
| Natives/Alaskans | 0.0 /100 | #311 | Tragic 80.9% |
| Nicaraguans | 0.0 /100 | #312 | Tragic 80.9% |
| Cape Verdeans | 0.0 /100 | #313 | Tragic 80.9% |
| Belizeans | 0.0 /100 | #314 | Tragic 80.9% |
| Apache | 0.0 /100 | #315 | Tragic 80.7% |
| Central American Indians | 0.0 /100 | #316 | Tragic 80.6% |