Cypriot vs Immigrants GED/Equivalency
COMPARE
Cypriot
Immigrants
GED/Equivalency
GED/Equivalency Comparison
Cypriots
Immigrants
88.9%
GED/EQUIVALENCY
99.9/ 100
METRIC RATING
14th/ 347
METRIC RANK
82.6%
GED/EQUIVALENCY
0.1/ 100
METRIC RATING
282nd/ 347
METRIC RANK
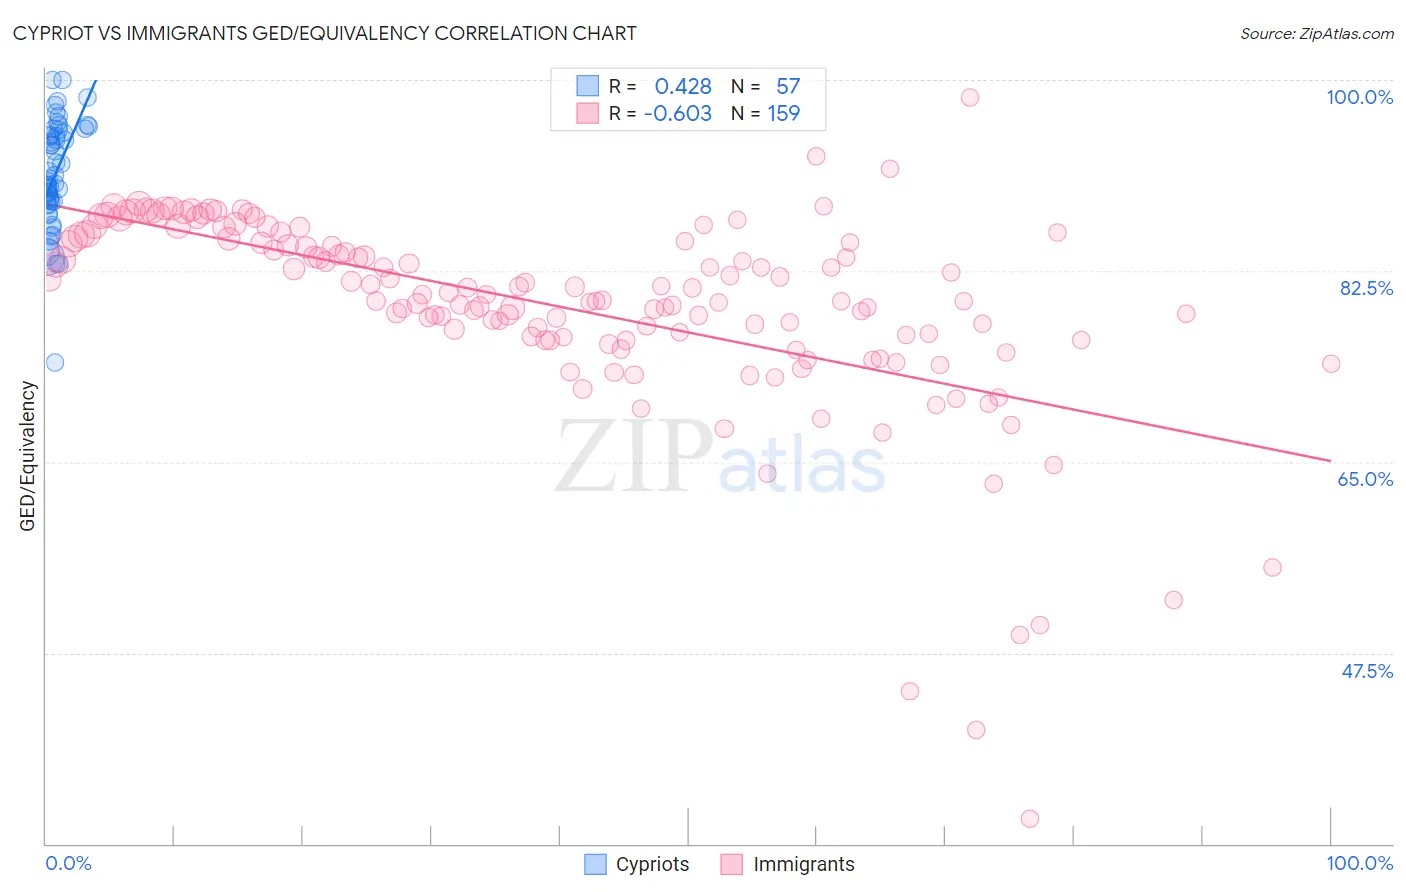
Cypriot vs Immigrants GED/Equivalency Correlation Chart
The statistical analysis conducted on geographies consisting of 61,870,289 people shows a moderate positive correlation between the proportion of Cypriots and percentage of population with at least ged/equivalency education in the United States with a correlation coefficient (R) of 0.428 and weighted average of 88.9%. Similarly, the statistical analysis conducted on geographies consisting of 577,784,417 people shows a significant negative correlation between the proportion of Immigrants and percentage of population with at least ged/equivalency education in the United States with a correlation coefficient (R) of -0.603 and weighted average of 82.6%, a difference of 7.7%.
GED/Equivalency Correlation Summary
| Measurement | Cypriot | Immigrants |
| Minimum | 74.1% | 32.3% |
| Maximum | 100.0% | 98.4% |
| Range | 25.9% | 66.2% |
| Mean | 91.4% | 79.2% |
| Median | 90.9% | 80.3% |
| Interquartile 25% (IQ1) | 88.7% | 76.2% |
| Interquartile 75% (IQ3) | 95.3% | 85.2% |
| Interquartile Range (IQR) | 6.6% | 9.1% |
| Standard Deviation (Sample) | 4.9% | 9.4% |
| Standard Deviation (Population) | 4.9% | 9.4% |
Similar Demographics by GED/Equivalency
Demographics Similar to Cypriots by GED/Equivalency
In terms of ged/equivalency, the demographic groups most similar to Cypriots are Okinawan (88.9%, a difference of 0.020%), Immigrants from Iran (88.9%, a difference of 0.030%), Lithuanian (88.9%, a difference of 0.040%), Immigrants from Taiwan (88.8%, a difference of 0.050%), and Bulgarian (89.0%, a difference of 0.080%).
| Demographics | Rating | Rank | GED/Equivalency |
| Eastern Europeans | 99.9 /100 | #7 | Exceptional 89.1% |
| Carpatho Rusyns | 99.9 /100 | #8 | Exceptional 89.1% |
| Chinese | 99.9 /100 | #9 | Exceptional 89.0% |
| Norwegians | 99.9 /100 | #10 | Exceptional 89.0% |
| Bulgarians | 99.9 /100 | #11 | Exceptional 89.0% |
| Lithuanians | 99.9 /100 | #12 | Exceptional 88.9% |
| Immigrants | Iran | 99.9 /100 | #13 | Exceptional 88.9% |
| Cypriots | 99.9 /100 | #14 | Exceptional 88.9% |
| Okinawans | 99.9 /100 | #15 | Exceptional 88.9% |
| Immigrants | Taiwan | 99.9 /100 | #16 | Exceptional 88.8% |
| Croatians | 99.9 /100 | #17 | Exceptional 88.8% |
| Slovenes | 99.9 /100 | #18 | Exceptional 88.8% |
| Swedes | 99.9 /100 | #19 | Exceptional 88.8% |
| Maltese | 99.9 /100 | #20 | Exceptional 88.6% |
| Luxembourgers | 99.8 /100 | #21 | Exceptional 88.6% |
Demographics Similar to Immigrants by GED/Equivalency
In terms of ged/equivalency, the demographic groups most similar to Immigrants are Indonesian (82.5%, a difference of 0.050%), Sioux (82.6%, a difference of 0.090%), Immigrants from Barbados (82.4%, a difference of 0.16%), Cheyenne (82.7%, a difference of 0.18%), and Immigrants from Fiji (82.7%, a difference of 0.19%).
| Demographics | Rating | Rank | GED/Equivalency |
| Seminole | 0.1 /100 | #275 | Tragic 82.8% |
| Blacks/African Americans | 0.1 /100 | #276 | Tragic 82.8% |
| Arapaho | 0.1 /100 | #277 | Tragic 82.8% |
| Immigrants | Laos | 0.1 /100 | #278 | Tragic 82.7% |
| Immigrants | Fiji | 0.1 /100 | #279 | Tragic 82.7% |
| Cheyenne | 0.1 /100 | #280 | Tragic 82.7% |
| Sioux | 0.1 /100 | #281 | Tragic 82.6% |
| Immigrants | Immigrants | 0.1 /100 | #282 | Tragic 82.6% |
| Indonesians | 0.1 /100 | #283 | Tragic 82.5% |
| Immigrants | Barbados | 0.1 /100 | #284 | Tragic 82.4% |
| Cajuns | 0.0 /100 | #285 | Tragic 82.4% |
| Immigrants | West Indies | 0.0 /100 | #286 | Tragic 82.4% |
| Japanese | 0.0 /100 | #287 | Tragic 82.4% |
| Pueblo | 0.0 /100 | #288 | Tragic 82.3% |
| Immigrants | Cambodia | 0.0 /100 | #289 | Tragic 82.2% |