Immigrants from Austria vs Immigrants GED/Equivalency
COMPARE
Immigrants from Austria
Immigrants
GED/Equivalency
GED/Equivalency Comparison
Immigrants from Austria
Immigrants
88.3%
GED/EQUIVALENCY
99.7/ 100
METRIC RATING
37th/ 347
METRIC RANK
82.6%
GED/EQUIVALENCY
0.1/ 100
METRIC RATING
282nd/ 347
METRIC RANK
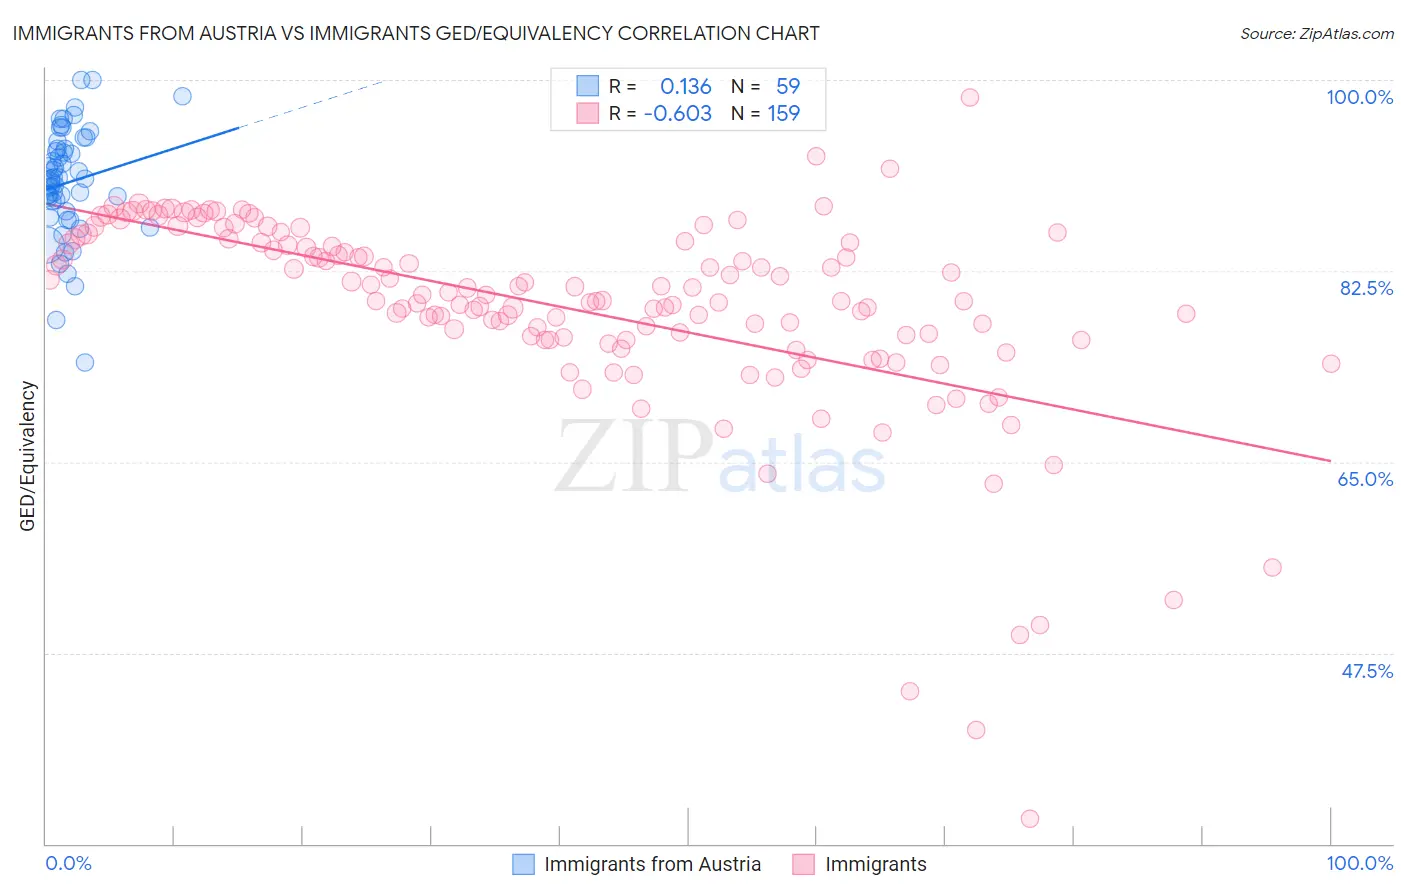
Immigrants from Austria vs Immigrants GED/Equivalency Correlation Chart
The statistical analysis conducted on geographies consisting of 167,973,751 people shows a poor positive correlation between the proportion of Immigrants from Austria and percentage of population with at least ged/equivalency education in the United States with a correlation coefficient (R) of 0.136 and weighted average of 88.3%. Similarly, the statistical analysis conducted on geographies consisting of 577,784,417 people shows a significant negative correlation between the proportion of Immigrants and percentage of population with at least ged/equivalency education in the United States with a correlation coefficient (R) of -0.603 and weighted average of 82.6%, a difference of 7.0%.
GED/Equivalency Correlation Summary
| Measurement | Immigrants from Austria | Immigrants |
| Minimum | 74.2% | 32.3% |
| Maximum | 100.0% | 98.4% |
| Range | 25.8% | 66.2% |
| Mean | 90.6% | 79.2% |
| Median | 90.9% | 80.3% |
| Interquartile 25% (IQ1) | 88.0% | 76.2% |
| Interquartile 75% (IQ3) | 93.7% | 85.2% |
| Interquartile Range (IQR) | 5.7% | 9.1% |
| Standard Deviation (Sample) | 5.0% | 9.4% |
| Standard Deviation (Population) | 5.0% | 9.4% |
Similar Demographics by GED/Equivalency
Demographics Similar to Immigrants from Austria by GED/Equivalency
In terms of ged/equivalency, the demographic groups most similar to Immigrants from Austria are Immigrants from Belgium (88.3%, a difference of 0.030%), Burmese (88.3%, a difference of 0.030%), Immigrants from South Central Asia (88.4%, a difference of 0.050%), Immigrants from Japan (88.4%, a difference of 0.070%), and Immigrants from Sweden (88.4%, a difference of 0.080%).
| Demographics | Rating | Rank | GED/Equivalency |
| Turks | 99.8 /100 | #30 | Exceptional 88.5% |
| Bhutanese | 99.8 /100 | #31 | Exceptional 88.4% |
| Danes | 99.8 /100 | #32 | Exceptional 88.4% |
| Immigrants | Sweden | 99.7 /100 | #33 | Exceptional 88.4% |
| Immigrants | Japan | 99.7 /100 | #34 | Exceptional 88.4% |
| Immigrants | South Central Asia | 99.7 /100 | #35 | Exceptional 88.4% |
| Immigrants | Belgium | 99.7 /100 | #36 | Exceptional 88.3% |
| Immigrants | Austria | 99.7 /100 | #37 | Exceptional 88.3% |
| Burmese | 99.7 /100 | #38 | Exceptional 88.3% |
| Immigrants | Israel | 99.6 /100 | #39 | Exceptional 88.2% |
| Italians | 99.6 /100 | #40 | Exceptional 88.2% |
| Finns | 99.6 /100 | #41 | Exceptional 88.2% |
| Cambodians | 99.6 /100 | #42 | Exceptional 88.2% |
| Immigrants | Scotland | 99.6 /100 | #43 | Exceptional 88.2% |
| Macedonians | 99.5 /100 | #44 | Exceptional 88.1% |
Demographics Similar to Immigrants by GED/Equivalency
In terms of ged/equivalency, the demographic groups most similar to Immigrants are Indonesian (82.5%, a difference of 0.050%), Sioux (82.6%, a difference of 0.090%), Immigrants from Barbados (82.4%, a difference of 0.16%), Cheyenne (82.7%, a difference of 0.18%), and Immigrants from Fiji (82.7%, a difference of 0.19%).
| Demographics | Rating | Rank | GED/Equivalency |
| Seminole | 0.1 /100 | #275 | Tragic 82.8% |
| Blacks/African Americans | 0.1 /100 | #276 | Tragic 82.8% |
| Arapaho | 0.1 /100 | #277 | Tragic 82.8% |
| Immigrants | Laos | 0.1 /100 | #278 | Tragic 82.7% |
| Immigrants | Fiji | 0.1 /100 | #279 | Tragic 82.7% |
| Cheyenne | 0.1 /100 | #280 | Tragic 82.7% |
| Sioux | 0.1 /100 | #281 | Tragic 82.6% |
| Immigrants | Immigrants | 0.1 /100 | #282 | Tragic 82.6% |
| Indonesians | 0.1 /100 | #283 | Tragic 82.5% |
| Immigrants | Barbados | 0.1 /100 | #284 | Tragic 82.4% |
| Cajuns | 0.0 /100 | #285 | Tragic 82.4% |
| Immigrants | West Indies | 0.0 /100 | #286 | Tragic 82.4% |
| Japanese | 0.0 /100 | #287 | Tragic 82.4% |
| Pueblo | 0.0 /100 | #288 | Tragic 82.3% |
| Immigrants | Cambodia | 0.0 /100 | #289 | Tragic 82.2% |