Kiowa vs Immigrants GED/Equivalency
COMPARE
Kiowa
Immigrants
GED/Equivalency
GED/Equivalency Comparison
Kiowa
Immigrants
83.1%
GED/EQUIVALENCY
0.2/ 100
METRIC RATING
266th/ 347
METRIC RANK
82.6%
GED/EQUIVALENCY
0.1/ 100
METRIC RATING
282nd/ 347
METRIC RANK
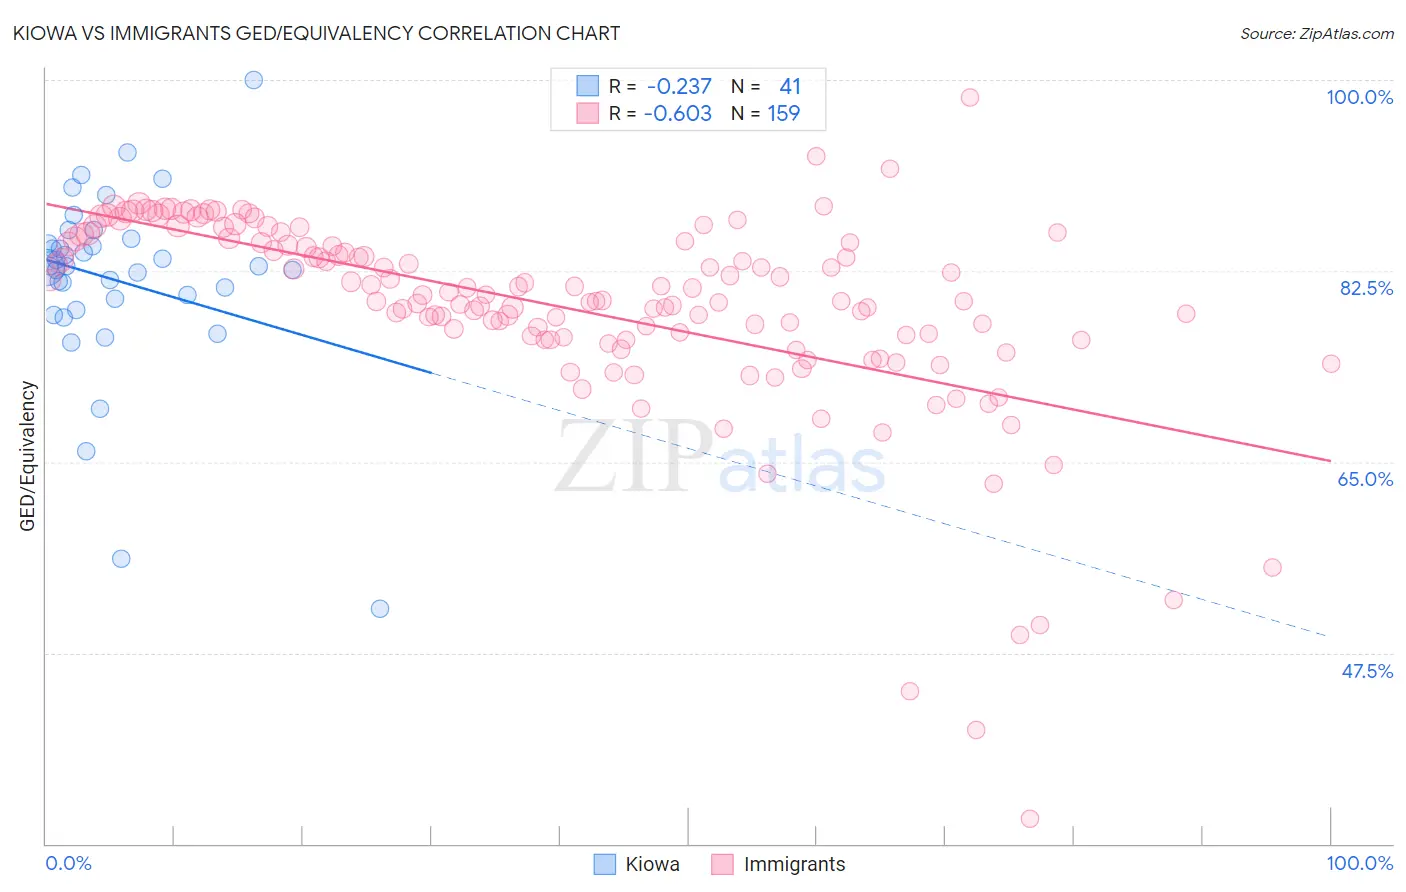
Kiowa vs Immigrants GED/Equivalency Correlation Chart
The statistical analysis conducted on geographies consisting of 56,101,840 people shows a weak negative correlation between the proportion of Kiowa and percentage of population with at least ged/equivalency education in the United States with a correlation coefficient (R) of -0.237 and weighted average of 83.1%. Similarly, the statistical analysis conducted on geographies consisting of 577,784,417 people shows a significant negative correlation between the proportion of Immigrants and percentage of population with at least ged/equivalency education in the United States with a correlation coefficient (R) of -0.603 and weighted average of 82.6%, a difference of 0.59%.
GED/Equivalency Correlation Summary
| Measurement | Kiowa | Immigrants |
| Minimum | 51.6% | 32.3% |
| Maximum | 100.0% | 98.4% |
| Range | 48.4% | 66.2% |
| Mean | 81.7% | 79.2% |
| Median | 82.9% | 80.3% |
| Interquartile 25% (IQ1) | 79.5% | 76.2% |
| Interquartile 75% (IQ3) | 85.2% | 85.2% |
| Interquartile Range (IQR) | 5.8% | 9.1% |
| Standard Deviation (Sample) | 8.7% | 9.4% |
| Standard Deviation (Population) | 8.6% | 9.4% |
Demographics Similar to Kiowa and Immigrants by GED/Equivalency
In terms of ged/equivalency, the demographic groups most similar to Kiowa are Bangladeshi (83.1%, a difference of 0.010%), West Indian (83.1%, a difference of 0.010%), Trinidadian and Tobagonian (83.0%, a difference of 0.020%), Immigrants from Burma/Myanmar (83.0%, a difference of 0.060%), and Hopi (83.0%, a difference of 0.10%). Similarly, the demographic groups most similar to Immigrants are Indonesian (82.5%, a difference of 0.050%), Sioux (82.6%, a difference of 0.090%), Immigrants from Barbados (82.4%, a difference of 0.16%), Cheyenne (82.7%, a difference of 0.18%), and Immigrants from Fiji (82.7%, a difference of 0.19%).
| Demographics | Rating | Rank | GED/Equivalency |
| Bangladeshis | 0.2 /100 | #264 | Tragic 83.1% |
| West Indians | 0.2 /100 | #265 | Tragic 83.1% |
| Kiowa | 0.2 /100 | #266 | Tragic 83.1% |
| Trinidadians and Tobagonians | 0.2 /100 | #267 | Tragic 83.0% |
| Immigrants | Burma/Myanmar | 0.2 /100 | #268 | Tragic 83.0% |
| Hopi | 0.2 /100 | #269 | Tragic 83.0% |
| Immigrants | Jamaica | 0.2 /100 | #270 | Tragic 82.9% |
| U.S. Virgin Islanders | 0.2 /100 | #271 | Tragic 82.9% |
| Barbadians | 0.1 /100 | #272 | Tragic 82.9% |
| Pennsylvania Germans | 0.1 /100 | #273 | Tragic 82.9% |
| Immigrants | Trinidad and Tobago | 0.1 /100 | #274 | Tragic 82.8% |
| Seminole | 0.1 /100 | #275 | Tragic 82.8% |
| Blacks/African Americans | 0.1 /100 | #276 | Tragic 82.8% |
| Arapaho | 0.1 /100 | #277 | Tragic 82.8% |
| Immigrants | Laos | 0.1 /100 | #278 | Tragic 82.7% |
| Immigrants | Fiji | 0.1 /100 | #279 | Tragic 82.7% |
| Cheyenne | 0.1 /100 | #280 | Tragic 82.7% |
| Sioux | 0.1 /100 | #281 | Tragic 82.6% |
| Immigrants | Immigrants | 0.1 /100 | #282 | Tragic 82.6% |
| Indonesians | 0.1 /100 | #283 | Tragic 82.5% |
| Immigrants | Barbados | 0.1 /100 | #284 | Tragic 82.4% |