Immigrants from South Eastern Asia vs Apache College, 1 year or more
COMPARE
Immigrants from South Eastern Asia
Apache
College, 1 year or more
College, 1 year or more Comparison
Immigrants from South Eastern Asia
Apache
58.5%
COLLEGE, 1 YEAR OR MORE
25.1/ 100
METRIC RATING
198th/ 347
METRIC RANK
51.8%
COLLEGE, 1 YEAR OR MORE
0.0/ 100
METRIC RATING
309th/ 347
METRIC RANK
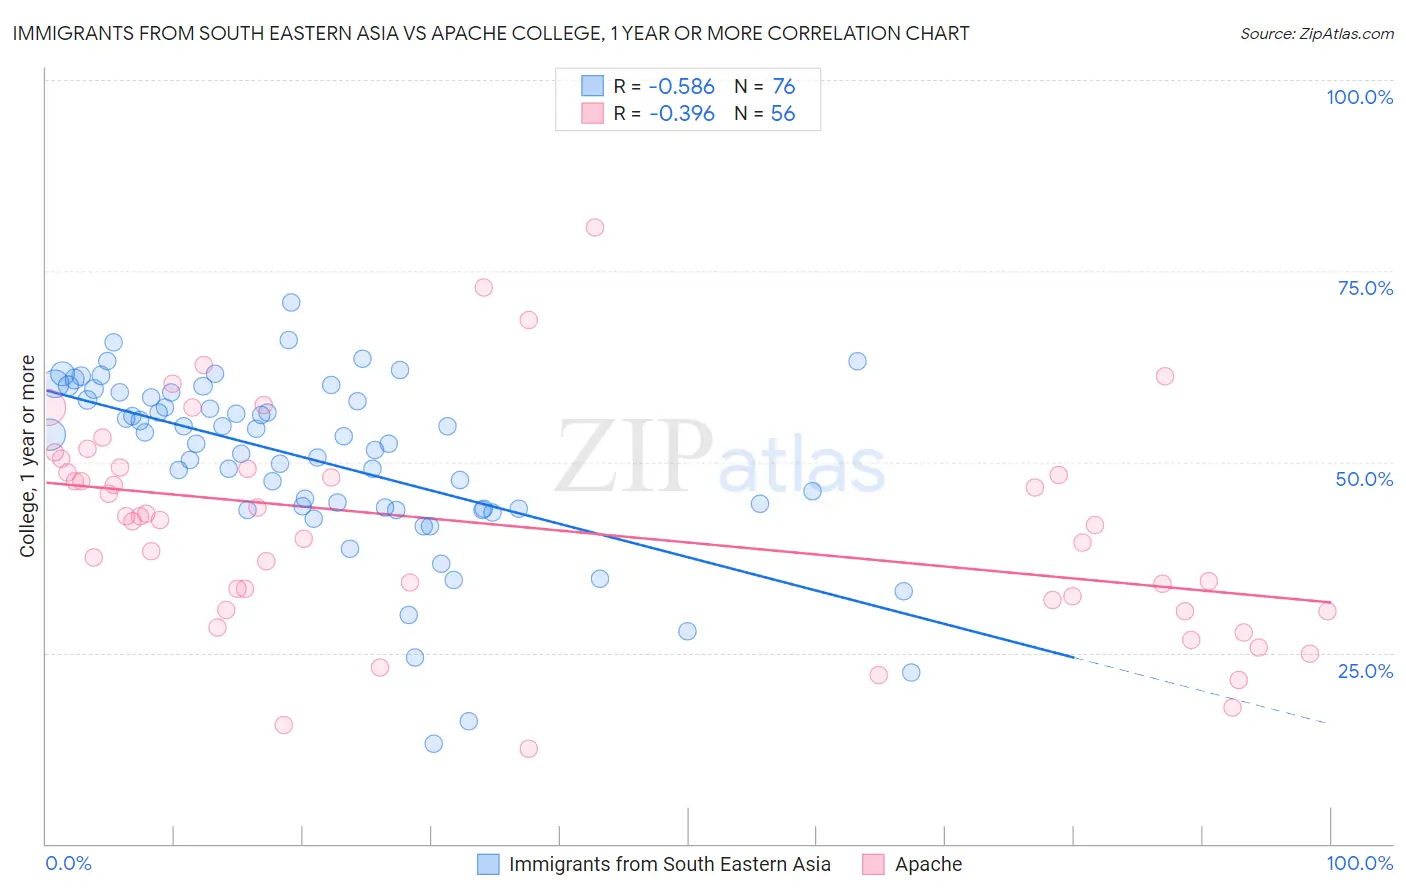
Immigrants from South Eastern Asia vs Apache College, 1 year or more Correlation Chart
The statistical analysis conducted on geographies consisting of 512,706,379 people shows a substantial negative correlation between the proportion of Immigrants from South Eastern Asia and percentage of population with at least college, 1 year or more education in the United States with a correlation coefficient (R) of -0.586 and weighted average of 58.5%. Similarly, the statistical analysis conducted on geographies consisting of 231,142,948 people shows a mild negative correlation between the proportion of Apache and percentage of population with at least college, 1 year or more education in the United States with a correlation coefficient (R) of -0.396 and weighted average of 51.8%, a difference of 13.0%.
College, 1 year or more Correlation Summary
| Measurement | Immigrants from South Eastern Asia | Apache |
| Minimum | 13.0% | 12.5% |
| Maximum | 70.8% | 80.6% |
| Range | 57.8% | 68.1% |
| Mean | 50.1% | 41.5% |
| Median | 52.9% | 42.4% |
| Interquartile 25% (IQ1) | 43.8% | 31.2% |
| Interquartile 75% (IQ3) | 58.7% | 49.2% |
| Interquartile Range (IQR) | 14.9% | 18.0% |
| Standard Deviation (Sample) | 11.6% | 14.3% |
| Standard Deviation (Population) | 11.5% | 14.1% |
Similar Demographics by College, 1 year or more
Demographics Similar to Immigrants from South Eastern Asia by College, 1 year or more
In terms of college, 1 year or more, the demographic groups most similar to Immigrants from South Eastern Asia are Slovak (58.5%, a difference of 0.040%), Immigrants from Thailand (58.6%, a difference of 0.070%), Spanish (58.5%, a difference of 0.070%), Dutch (58.6%, a difference of 0.080%), and Guamanian/Chamorro (58.6%, a difference of 0.080%).
| Demographics | Rating | Rank | College, 1 year or more |
| Immigrants | Philippines | 29.2 /100 | #191 | Fair 58.7% |
| Colombians | 27.6 /100 | #192 | Fair 58.7% |
| Peruvians | 27.5 /100 | #193 | Fair 58.6% |
| Costa Ricans | 26.4 /100 | #194 | Fair 58.6% |
| Dutch | 26.2 /100 | #195 | Fair 58.6% |
| Guamanians/Chamorros | 26.2 /100 | #196 | Fair 58.6% |
| Immigrants | Thailand | 26.0 /100 | #197 | Fair 58.6% |
| Immigrants | South Eastern Asia | 25.1 /100 | #198 | Fair 58.5% |
| Slovaks | 24.6 /100 | #199 | Fair 58.5% |
| Spanish | 24.2 /100 | #200 | Fair 58.5% |
| Nigerians | 23.0 /100 | #201 | Fair 58.5% |
| Immigrants | South America | 21.9 /100 | #202 | Fair 58.4% |
| Ghanaians | 20.9 /100 | #203 | Fair 58.4% |
| Panamanians | 19.2 /100 | #204 | Poor 58.3% |
| Immigrants | Zaire | 18.7 /100 | #205 | Poor 58.3% |
Demographics Similar to Apache by College, 1 year or more
In terms of college, 1 year or more, the demographic groups most similar to Apache are Salvadoran (51.8%, a difference of 0.010%), Immigrants from Portugal (51.9%, a difference of 0.11%), Mexican American Indian (51.9%, a difference of 0.22%), Honduran (51.6%, a difference of 0.39%), and Seminole (52.1%, a difference of 0.55%).
| Demographics | Rating | Rank | College, 1 year or more |
| Puerto Ricans | 0.0 /100 | #302 | Tragic 52.2% |
| Creek | 0.0 /100 | #303 | Tragic 52.2% |
| Central Americans | 0.0 /100 | #304 | Tragic 52.1% |
| Seminole | 0.0 /100 | #305 | Tragic 52.1% |
| Mexican American Indians | 0.0 /100 | #306 | Tragic 51.9% |
| Immigrants | Portugal | 0.0 /100 | #307 | Tragic 51.9% |
| Salvadorans | 0.0 /100 | #308 | Tragic 51.8% |
| Apache | 0.0 /100 | #309 | Tragic 51.8% |
| Hondurans | 0.0 /100 | #310 | Tragic 51.6% |
| Immigrants | Haiti | 0.0 /100 | #311 | Tragic 51.5% |
| Pueblo | 0.0 /100 | #312 | Tragic 51.5% |
| Immigrants | Caribbean | 0.0 /100 | #313 | Tragic 51.4% |
| Fijians | 0.0 /100 | #314 | Tragic 51.3% |
| Guatemalans | 0.0 /100 | #315 | Tragic 51.2% |
| Cajuns | 0.0 /100 | #316 | Tragic 51.2% |