Alaska Native vs Apache College, 1 year or more
COMPARE
Alaska Native
Apache
College, 1 year or more
College, 1 year or more Comparison
Alaska Natives
Apache
53.4%
COLLEGE, 1 YEAR OR MORE
0.0/ 100
METRIC RATING
288th/ 347
METRIC RANK
51.8%
COLLEGE, 1 YEAR OR MORE
0.0/ 100
METRIC RATING
309th/ 347
METRIC RANK
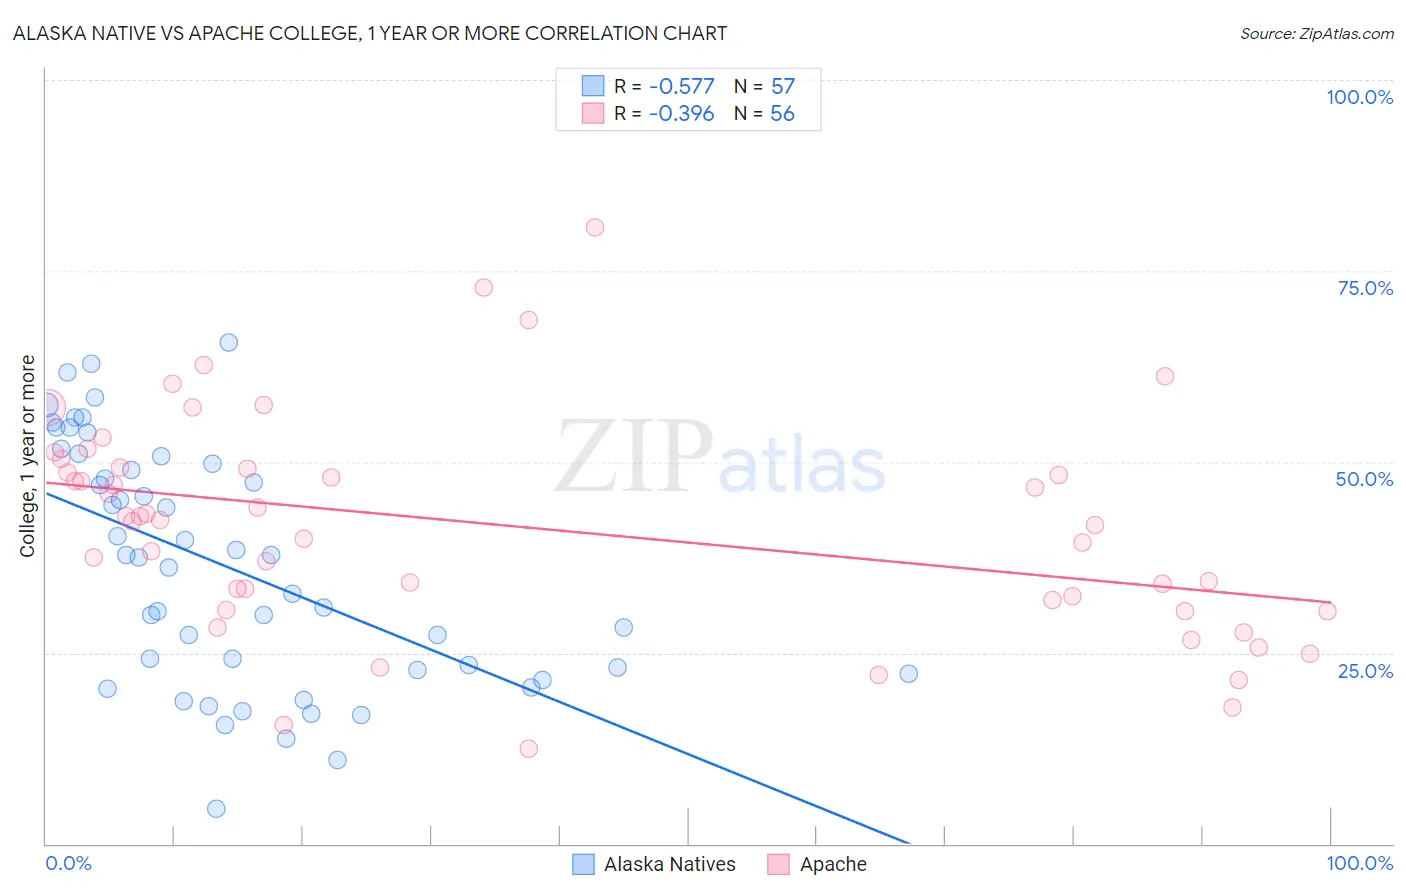
Alaska Native vs Apache College, 1 year or more Correlation Chart
The statistical analysis conducted on geographies consisting of 76,778,531 people shows a substantial negative correlation between the proportion of Alaska Natives and percentage of population with at least college, 1 year or more education in the United States with a correlation coefficient (R) of -0.577 and weighted average of 53.4%. Similarly, the statistical analysis conducted on geographies consisting of 231,142,948 people shows a mild negative correlation between the proportion of Apache and percentage of population with at least college, 1 year or more education in the United States with a correlation coefficient (R) of -0.396 and weighted average of 51.8%, a difference of 3.1%.
College, 1 year or more Correlation Summary
| Measurement | Alaska Native | Apache |
| Minimum | 4.6% | 12.5% |
| Maximum | 65.6% | 80.6% |
| Range | 61.0% | 68.1% |
| Mean | 36.3% | 41.5% |
| Median | 37.5% | 42.4% |
| Interquartile 25% (IQ1) | 22.5% | 31.2% |
| Interquartile 75% (IQ3) | 50.3% | 49.2% |
| Interquartile Range (IQR) | 27.8% | 18.0% |
| Standard Deviation (Sample) | 15.6% | 14.3% |
| Standard Deviation (Population) | 15.5% | 14.1% |
Similar Demographics by College, 1 year or more
Demographics Similar to Alaska Natives by College, 1 year or more
In terms of college, 1 year or more, the demographic groups most similar to Alaska Natives are Immigrants from Ecuador (53.4%, a difference of 0.0%), Alaskan Athabascan (53.4%, a difference of 0.020%), Cuban (53.4%, a difference of 0.070%), Immigrants from Belize (53.5%, a difference of 0.17%), and Central American Indian (53.5%, a difference of 0.20%).
| Demographics | Rating | Rank | College, 1 year or more |
| Colville | 0.1 /100 | #281 | Tragic 54.1% |
| Guyanese | 0.1 /100 | #282 | Tragic 54.1% |
| Nicaraguans | 0.1 /100 | #283 | Tragic 53.9% |
| Ute | 0.1 /100 | #284 | Tragic 53.8% |
| Immigrants | Guyana | 0.1 /100 | #285 | Tragic 53.5% |
| Central American Indians | 0.1 /100 | #286 | Tragic 53.5% |
| Immigrants | Belize | 0.1 /100 | #287 | Tragic 53.5% |
| Alaska Natives | 0.0 /100 | #288 | Tragic 53.4% |
| Immigrants | Ecuador | 0.0 /100 | #289 | Tragic 53.4% |
| Alaskan Athabascans | 0.0 /100 | #290 | Tragic 53.4% |
| Cubans | 0.0 /100 | #291 | Tragic 53.4% |
| Chickasaw | 0.0 /100 | #292 | Tragic 53.3% |
| Blacks/African Americans | 0.0 /100 | #293 | Tragic 53.3% |
| Cherokee | 0.0 /100 | #294 | Tragic 53.2% |
| Yaqui | 0.0 /100 | #295 | Tragic 53.2% |
Demographics Similar to Apache by College, 1 year or more
In terms of college, 1 year or more, the demographic groups most similar to Apache are Salvadoran (51.8%, a difference of 0.010%), Immigrants from Portugal (51.9%, a difference of 0.11%), Mexican American Indian (51.9%, a difference of 0.22%), Honduran (51.6%, a difference of 0.39%), and Seminole (52.1%, a difference of 0.55%).
| Demographics | Rating | Rank | College, 1 year or more |
| Puerto Ricans | 0.0 /100 | #302 | Tragic 52.2% |
| Creek | 0.0 /100 | #303 | Tragic 52.2% |
| Central Americans | 0.0 /100 | #304 | Tragic 52.1% |
| Seminole | 0.0 /100 | #305 | Tragic 52.1% |
| Mexican American Indians | 0.0 /100 | #306 | Tragic 51.9% |
| Immigrants | Portugal | 0.0 /100 | #307 | Tragic 51.9% |
| Salvadorans | 0.0 /100 | #308 | Tragic 51.8% |
| Apache | 0.0 /100 | #309 | Tragic 51.8% |
| Hondurans | 0.0 /100 | #310 | Tragic 51.6% |
| Immigrants | Haiti | 0.0 /100 | #311 | Tragic 51.5% |
| Pueblo | 0.0 /100 | #312 | Tragic 51.5% |
| Immigrants | Caribbean | 0.0 /100 | #313 | Tragic 51.4% |
| Fijians | 0.0 /100 | #314 | Tragic 51.3% |
| Guatemalans | 0.0 /100 | #315 | Tragic 51.2% |
| Cajuns | 0.0 /100 | #316 | Tragic 51.2% |