Samoan vs Apache College, 1 year or more
COMPARE
Samoan
Apache
College, 1 year or more
College, 1 year or more Comparison
Samoans
Apache
56.2%
COLLEGE, 1 YEAR OR MORE
1.6/ 100
METRIC RATING
237th/ 347
METRIC RANK
51.8%
COLLEGE, 1 YEAR OR MORE
0.0/ 100
METRIC RATING
309th/ 347
METRIC RANK
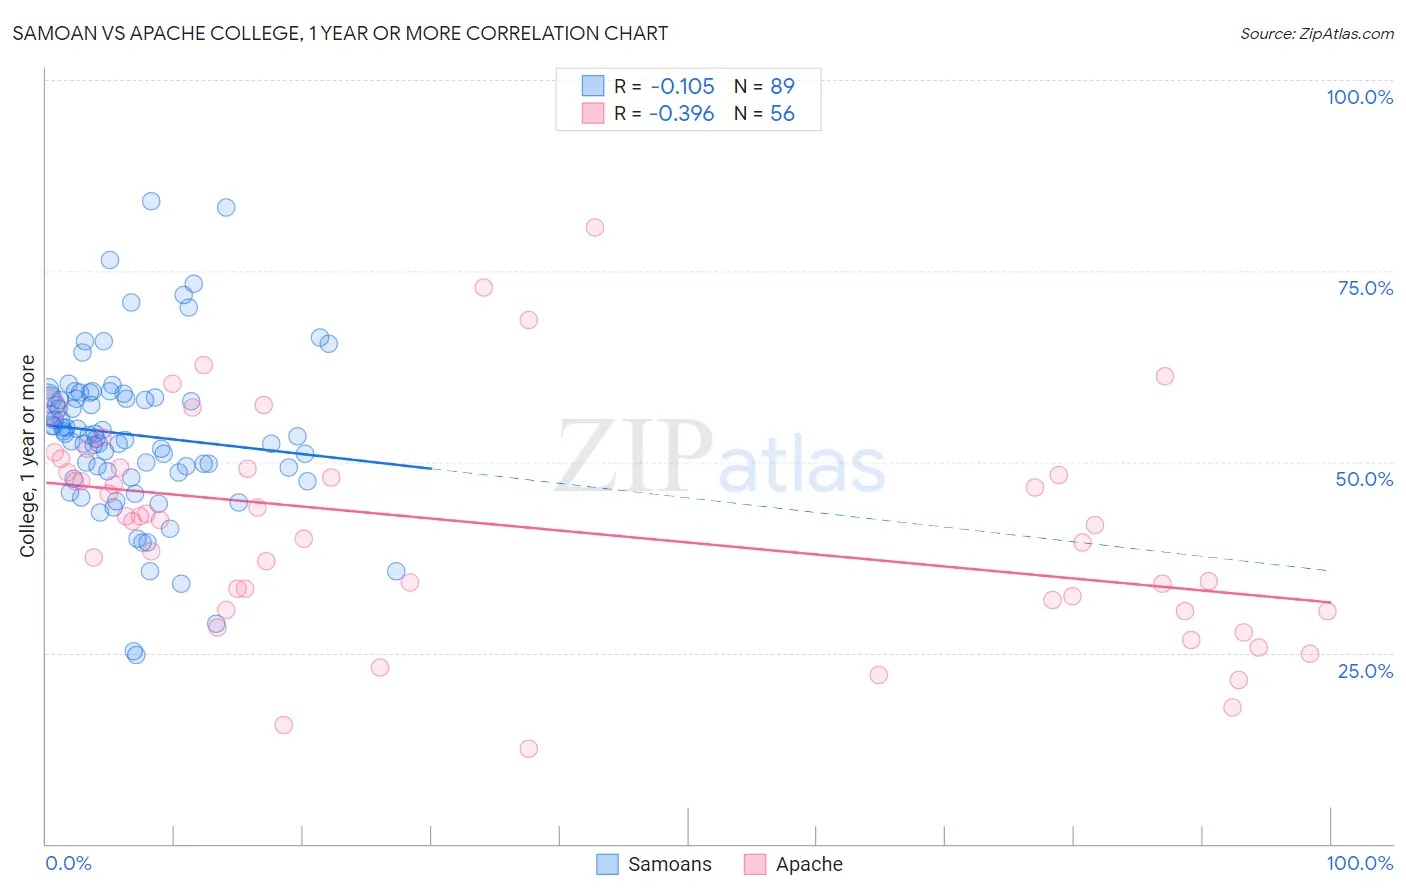
Samoan vs Apache College, 1 year or more Correlation Chart
The statistical analysis conducted on geographies consisting of 225,205,919 people shows a poor negative correlation between the proportion of Samoans and percentage of population with at least college, 1 year or more education in the United States with a correlation coefficient (R) of -0.105 and weighted average of 56.2%. Similarly, the statistical analysis conducted on geographies consisting of 231,142,948 people shows a mild negative correlation between the proportion of Apache and percentage of population with at least college, 1 year or more education in the United States with a correlation coefficient (R) of -0.396 and weighted average of 51.8%, a difference of 8.4%.
College, 1 year or more Correlation Summary
| Measurement | Samoan | Apache |
| Minimum | 24.6% | 12.5% |
| Maximum | 84.1% | 80.6% |
| Range | 59.5% | 68.1% |
| Mean | 53.6% | 41.5% |
| Median | 53.6% | 42.4% |
| Interquartile 25% (IQ1) | 48.7% | 31.2% |
| Interquartile 75% (IQ3) | 58.5% | 49.2% |
| Interquartile Range (IQR) | 9.8% | 18.0% |
| Standard Deviation (Sample) | 10.6% | 14.3% |
| Standard Deviation (Population) | 10.5% | 14.1% |
Similar Demographics by College, 1 year or more
Demographics Similar to Samoans by College, 1 year or more
In terms of college, 1 year or more, the demographic groups most similar to Samoans are Iroquois (56.2%, a difference of 0.11%), Spanish American (56.3%, a difference of 0.16%), West Indian (56.3%, a difference of 0.16%), Barbadian (56.0%, a difference of 0.27%), and Puget Sound Salish (55.9%, a difference of 0.47%).
| Demographics | Rating | Rank | College, 1 year or more |
| Liberians | 3.1 /100 | #230 | Tragic 56.7% |
| Immigrants | Burma/Myanmar | 2.7 /100 | #231 | Tragic 56.6% |
| Immigrants | Bangladesh | 2.6 /100 | #232 | Tragic 56.6% |
| Immigrants | Nonimmigrants | 2.5 /100 | #233 | Tragic 56.5% |
| Spanish Americans | 1.8 /100 | #234 | Tragic 56.3% |
| West Indians | 1.8 /100 | #235 | Tragic 56.3% |
| Iroquois | 1.7 /100 | #236 | Tragic 56.2% |
| Samoans | 1.6 /100 | #237 | Tragic 56.2% |
| Barbadians | 1.3 /100 | #238 | Tragic 56.0% |
| Puget Sound Salish | 1.1 /100 | #239 | Tragic 55.9% |
| Trinidadians and Tobagonians | 1.1 /100 | #240 | Tragic 55.8% |
| French American Indians | 1.0 /100 | #241 | Tragic 55.8% |
| Marshallese | 1.0 /100 | #242 | Tragic 55.8% |
| Osage | 1.0 /100 | #243 | Tragic 55.8% |
| Chippewa | 0.9 /100 | #244 | Tragic 55.7% |
Demographics Similar to Apache by College, 1 year or more
In terms of college, 1 year or more, the demographic groups most similar to Apache are Salvadoran (51.8%, a difference of 0.010%), Immigrants from Portugal (51.9%, a difference of 0.11%), Mexican American Indian (51.9%, a difference of 0.22%), Honduran (51.6%, a difference of 0.39%), and Seminole (52.1%, a difference of 0.55%).
| Demographics | Rating | Rank | College, 1 year or more |
| Puerto Ricans | 0.0 /100 | #302 | Tragic 52.2% |
| Creek | 0.0 /100 | #303 | Tragic 52.2% |
| Central Americans | 0.0 /100 | #304 | Tragic 52.1% |
| Seminole | 0.0 /100 | #305 | Tragic 52.1% |
| Mexican American Indians | 0.0 /100 | #306 | Tragic 51.9% |
| Immigrants | Portugal | 0.0 /100 | #307 | Tragic 51.9% |
| Salvadorans | 0.0 /100 | #308 | Tragic 51.8% |
| Apache | 0.0 /100 | #309 | Tragic 51.8% |
| Hondurans | 0.0 /100 | #310 | Tragic 51.6% |
| Immigrants | Haiti | 0.0 /100 | #311 | Tragic 51.5% |
| Pueblo | 0.0 /100 | #312 | Tragic 51.5% |
| Immigrants | Caribbean | 0.0 /100 | #313 | Tragic 51.4% |
| Fijians | 0.0 /100 | #314 | Tragic 51.3% |
| Guatemalans | 0.0 /100 | #315 | Tragic 51.2% |
| Cajuns | 0.0 /100 | #316 | Tragic 51.2% |