Immigrants from South Eastern Asia vs Korean College, 1 year or more
COMPARE
Immigrants from South Eastern Asia
Korean
College, 1 year or more
College, 1 year or more Comparison
Immigrants from South Eastern Asia
Koreans
58.5%
COLLEGE, 1 YEAR OR MORE
25.1/ 100
METRIC RATING
198th/ 347
METRIC RANK
59.7%
COLLEGE, 1 YEAR OR MORE
58.5/ 100
METRIC RATING
162nd/ 347
METRIC RANK
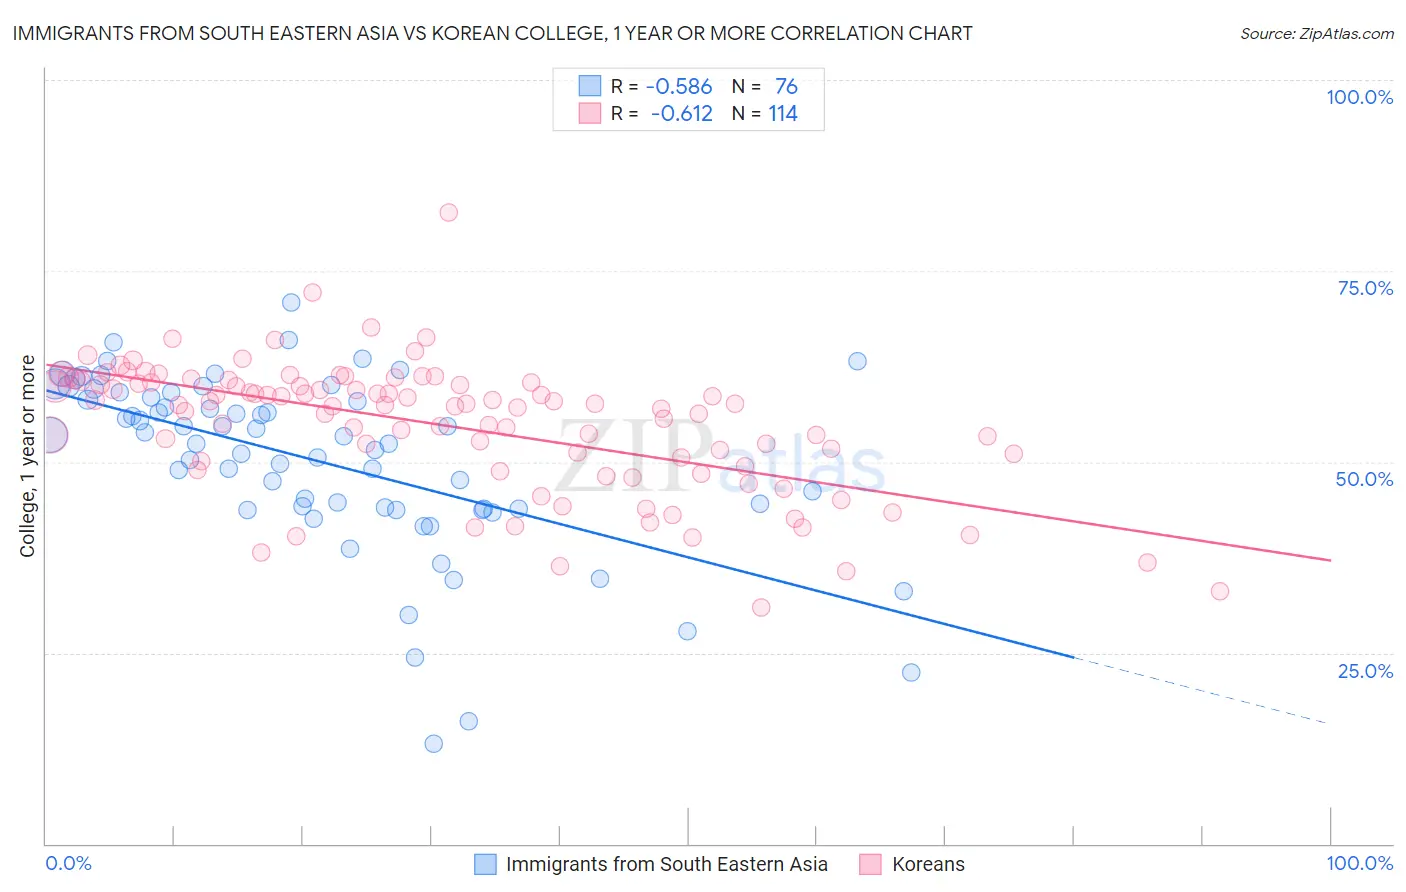
Immigrants from South Eastern Asia vs Korean College, 1 year or more Correlation Chart
The statistical analysis conducted on geographies consisting of 512,706,379 people shows a substantial negative correlation between the proportion of Immigrants from South Eastern Asia and percentage of population with at least college, 1 year or more education in the United States with a correlation coefficient (R) of -0.586 and weighted average of 58.5%. Similarly, the statistical analysis conducted on geographies consisting of 510,942,861 people shows a significant negative correlation between the proportion of Koreans and percentage of population with at least college, 1 year or more education in the United States with a correlation coefficient (R) of -0.612 and weighted average of 59.7%, a difference of 1.9%.
College, 1 year or more Correlation Summary
| Measurement | Immigrants from South Eastern Asia | Korean |
| Minimum | 13.0% | 31.0% |
| Maximum | 70.8% | 82.6% |
| Range | 57.8% | 51.6% |
| Mean | 50.1% | 54.8% |
| Median | 52.9% | 57.4% |
| Interquartile 25% (IQ1) | 43.8% | 50.1% |
| Interquartile 75% (IQ3) | 58.7% | 60.4% |
| Interquartile Range (IQR) | 14.9% | 10.3% |
| Standard Deviation (Sample) | 11.6% | 8.5% |
| Standard Deviation (Population) | 11.5% | 8.5% |
Similar Demographics by College, 1 year or more
Demographics Similar to Immigrants from South Eastern Asia by College, 1 year or more
In terms of college, 1 year or more, the demographic groups most similar to Immigrants from South Eastern Asia are Slovak (58.5%, a difference of 0.040%), Immigrants from Thailand (58.6%, a difference of 0.070%), Spanish (58.5%, a difference of 0.070%), Dutch (58.6%, a difference of 0.080%), and Guamanian/Chamorro (58.6%, a difference of 0.080%).
| Demographics | Rating | Rank | College, 1 year or more |
| Immigrants | Philippines | 29.2 /100 | #191 | Fair 58.7% |
| Colombians | 27.6 /100 | #192 | Fair 58.7% |
| Peruvians | 27.5 /100 | #193 | Fair 58.6% |
| Costa Ricans | 26.4 /100 | #194 | Fair 58.6% |
| Dutch | 26.2 /100 | #195 | Fair 58.6% |
| Guamanians/Chamorros | 26.2 /100 | #196 | Fair 58.6% |
| Immigrants | Thailand | 26.0 /100 | #197 | Fair 58.6% |
| Immigrants | South Eastern Asia | 25.1 /100 | #198 | Fair 58.5% |
| Slovaks | 24.6 /100 | #199 | Fair 58.5% |
| Spanish | 24.2 /100 | #200 | Fair 58.5% |
| Nigerians | 23.0 /100 | #201 | Fair 58.5% |
| Immigrants | South America | 21.9 /100 | #202 | Fair 58.4% |
| Ghanaians | 20.9 /100 | #203 | Fair 58.4% |
| Panamanians | 19.2 /100 | #204 | Poor 58.3% |
| Immigrants | Zaire | 18.7 /100 | #205 | Poor 58.3% |
Demographics Similar to Koreans by College, 1 year or more
In terms of college, 1 year or more, the demographic groups most similar to Koreans are Immigrants from Somalia (59.7%, a difference of 0.010%), Belgian (59.7%, a difference of 0.020%), Irish (59.6%, a difference of 0.13%), Immigrants from Africa (59.6%, a difference of 0.13%), and Immigrants from North Macedonia (59.5%, a difference of 0.29%).
| Demographics | Rating | Rank | College, 1 year or more |
| Moroccans | 72.9 /100 | #155 | Good 60.2% |
| Finns | 72.9 /100 | #156 | Good 60.2% |
| Immigrants | Armenia | 68.8 /100 | #157 | Good 60.0% |
| English | 67.2 /100 | #158 | Good 60.0% |
| Immigrants | Iraq | 67.0 /100 | #159 | Good 60.0% |
| South American Indians | 66.9 /100 | #160 | Good 60.0% |
| Somalis | 64.5 /100 | #161 | Good 59.9% |
| Koreans | 58.5 /100 | #162 | Average 59.7% |
| Immigrants | Somalia | 58.3 /100 | #163 | Average 59.7% |
| Belgians | 58.1 /100 | #164 | Average 59.7% |
| Irish | 56.1 /100 | #165 | Average 59.6% |
| Immigrants | Africa | 56.1 /100 | #166 | Average 59.6% |
| Immigrants | North Macedonia | 53.1 /100 | #167 | Average 59.5% |
| Hungarians | 52.9 /100 | #168 | Average 59.5% |
| Immigrants | Southern Europe | 52.7 /100 | #169 | Average 59.5% |