Immigrants from South Eastern Asia vs Apache In Labor Force | Age 20-64
COMPARE
Immigrants from South Eastern Asia
Apache
In Labor Force | Age 20-64
In Labor Force | Age 20-64 Comparison
Immigrants from South Eastern Asia
Apache
79.8%
IN LABOR FORCE | AGE 20-64
80.4/ 100
METRIC RATING
140th/ 347
METRIC RANK
73.7%
IN LABOR FORCE | AGE 20-64
0.0/ 100
METRIC RATING
334th/ 347
METRIC RANK
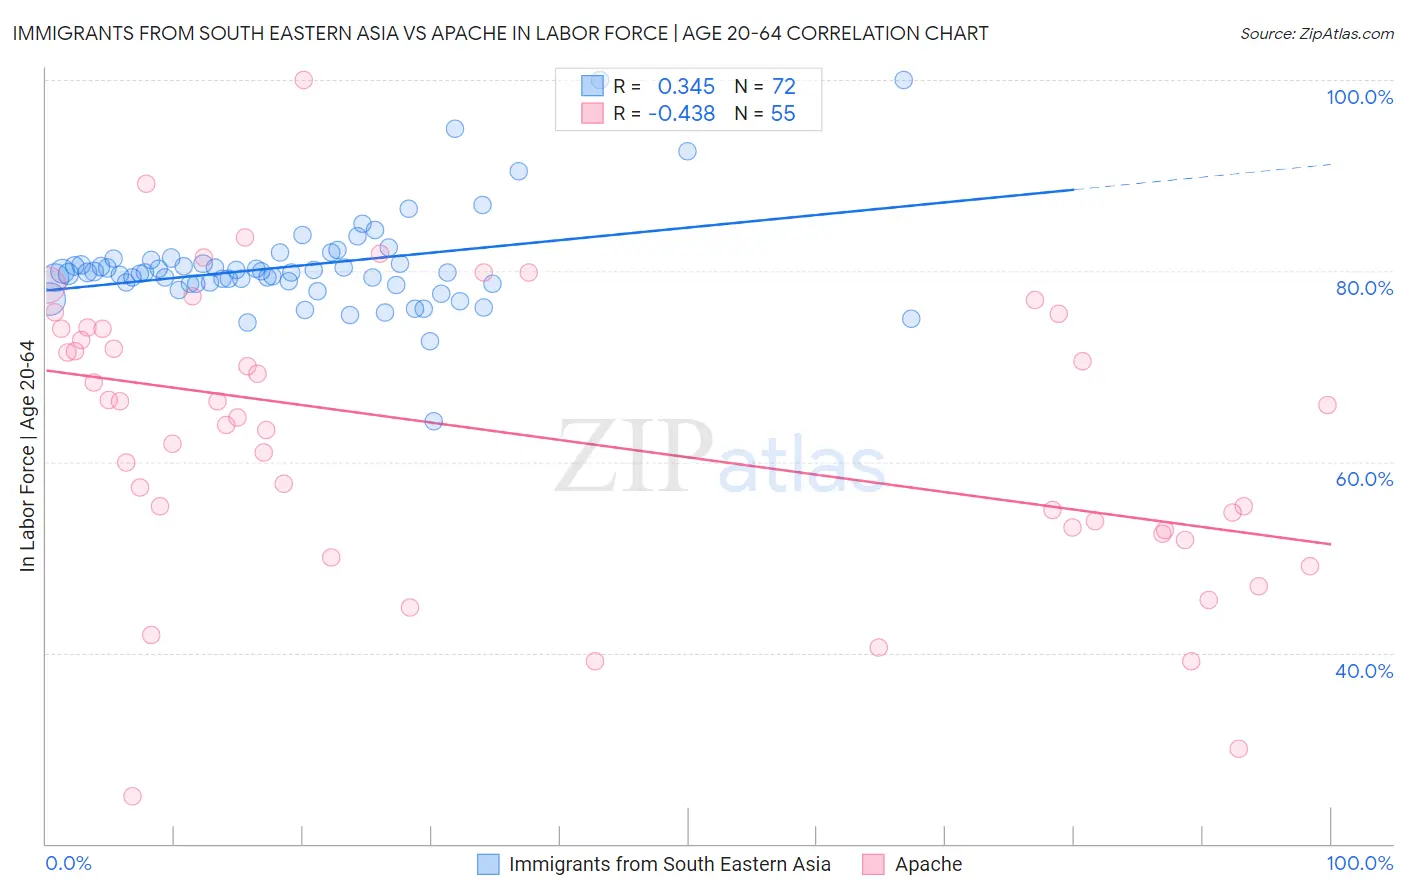
Immigrants from South Eastern Asia vs Apache In Labor Force | Age 20-64 Correlation Chart
The statistical analysis conducted on geographies consisting of 512,697,345 people shows a mild positive correlation between the proportion of Immigrants from South Eastern Asia and labor force participation rate among population between the ages 20 and 64 in the United States with a correlation coefficient (R) of 0.345 and weighted average of 79.8%. Similarly, the statistical analysis conducted on geographies consisting of 231,122,783 people shows a moderate negative correlation between the proportion of Apache and labor force participation rate among population between the ages 20 and 64 in the United States with a correlation coefficient (R) of -0.438 and weighted average of 73.7%, a difference of 8.3%.
In Labor Force | Age 20-64 Correlation Summary
| Measurement | Immigrants from South Eastern Asia | Apache |
| Minimum | 64.3% | 25.0% |
| Maximum | 100.0% | 100.0% |
| Range | 35.7% | 75.0% |
| Mean | 80.5% | 62.9% |
| Median | 79.8% | 64.7% |
| Interquartile 25% (IQ1) | 78.7% | 52.8% |
| Interquartile 75% (IQ3) | 80.9% | 74.0% |
| Interquartile Range (IQR) | 2.2% | 21.2% |
| Standard Deviation (Sample) | 5.3% | 15.1% |
| Standard Deviation (Population) | 5.2% | 15.0% |
Similar Demographics by In Labor Force | Age 20-64
Demographics Similar to Immigrants from South Eastern Asia by In Labor Force | Age 20-64
In terms of in labor force | age 20-64, the demographic groups most similar to Immigrants from South Eastern Asia are Immigrants from Israel (79.8%, a difference of 0.0%), Slovak (79.8%, a difference of 0.010%), Immigrants from Sweden (79.8%, a difference of 0.010%), Korean (79.8%, a difference of 0.010%), and Pakistani (79.8%, a difference of 0.010%).
| Demographics | Rating | Rank | In Labor Force | Age 20-64 |
| South American Indians | 87.6 /100 | #133 | Excellent 79.9% |
| Belgians | 87.4 /100 | #134 | Excellent 79.9% |
| Ukrainians | 86.8 /100 | #135 | Excellent 79.9% |
| Immigrants | Singapore | 86.7 /100 | #136 | Excellent 79.9% |
| Immigrants | Ukraine | 86.5 /100 | #137 | Excellent 79.9% |
| Immigrants | Nigeria | 86.4 /100 | #138 | Excellent 79.9% |
| Immigrants | Spain | 83.9 /100 | #139 | Excellent 79.8% |
| Immigrants | South Eastern Asia | 80.4 /100 | #140 | Excellent 79.8% |
| Immigrants | Israel | 80.0 /100 | #141 | Good 79.8% |
| Slovaks | 79.9 /100 | #142 | Good 79.8% |
| Immigrants | Sweden | 79.7 /100 | #143 | Good 79.8% |
| Koreans | 79.6 /100 | #144 | Good 79.8% |
| Pakistanis | 79.3 /100 | #145 | Good 79.8% |
| Immigrants | Southern Europe | 78.9 /100 | #146 | Good 79.8% |
| Immigrants | Philippines | 78.0 /100 | #147 | Good 79.8% |
Demographics Similar to Apache by In Labor Force | Age 20-64
In terms of in labor force | age 20-64, the demographic groups most similar to Apache are Ute (73.7%, a difference of 0.020%), Native/Alaskan (73.9%, a difference of 0.30%), Crow (73.3%, a difference of 0.52%), Yup'ik (73.2%, a difference of 0.64%), and Puerto Rican (73.1%, a difference of 0.85%).
| Demographics | Rating | Rank | In Labor Force | Age 20-64 |
| Sioux | 0.0 /100 | #327 | Tragic 75.0% |
| Kiowa | 0.0 /100 | #328 | Tragic 75.0% |
| Cheyenne | 0.0 /100 | #329 | Tragic 74.8% |
| Colville | 0.0 /100 | #330 | Tragic 74.8% |
| Paiute | 0.0 /100 | #331 | Tragic 74.7% |
| Arapaho | 0.0 /100 | #332 | Tragic 74.4% |
| Natives/Alaskans | 0.0 /100 | #333 | Tragic 73.9% |
| Apache | 0.0 /100 | #334 | Tragic 73.7% |
| Ute | 0.0 /100 | #335 | Tragic 73.7% |
| Crow | 0.0 /100 | #336 | Tragic 73.3% |
| Yup'ik | 0.0 /100 | #337 | Tragic 73.2% |
| Puerto Ricans | 0.0 /100 | #338 | Tragic 73.1% |
| Houma | 0.0 /100 | #339 | Tragic 72.7% |
| Pueblo | 0.0 /100 | #340 | Tragic 72.6% |
| Immigrants | Yemen | 0.0 /100 | #341 | Tragic 72.3% |