Immigrants from South Eastern Asia vs Vietnamese College, 1 year or more
COMPARE
Immigrants from South Eastern Asia
Vietnamese
College, 1 year or more
College, 1 year or more Comparison
Immigrants from South Eastern Asia
Vietnamese
58.5%
COLLEGE, 1 YEAR OR MORE
25.1/ 100
METRIC RATING
198th/ 347
METRIC RANK
57.0%
COLLEGE, 1 YEAR OR MORE
4.7/ 100
METRIC RATING
225th/ 347
METRIC RANK
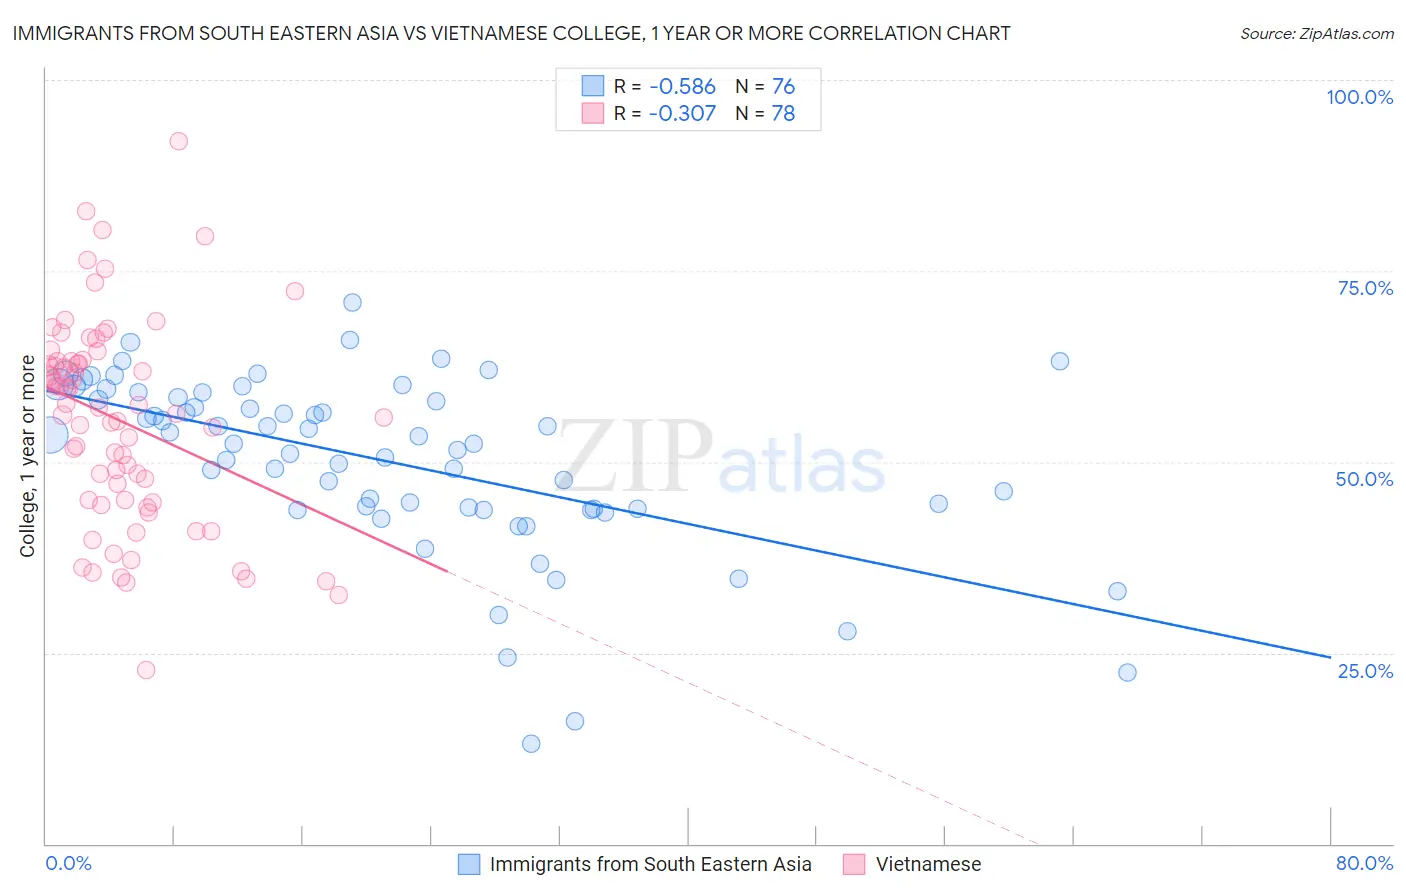
Immigrants from South Eastern Asia vs Vietnamese College, 1 year or more Correlation Chart
The statistical analysis conducted on geographies consisting of 512,706,379 people shows a substantial negative correlation between the proportion of Immigrants from South Eastern Asia and percentage of population with at least college, 1 year or more education in the United States with a correlation coefficient (R) of -0.586 and weighted average of 58.5%. Similarly, the statistical analysis conducted on geographies consisting of 170,751,543 people shows a mild negative correlation between the proportion of Vietnamese and percentage of population with at least college, 1 year or more education in the United States with a correlation coefficient (R) of -0.307 and weighted average of 57.0%, a difference of 2.6%.
College, 1 year or more Correlation Summary
| Measurement | Immigrants from South Eastern Asia | Vietnamese |
| Minimum | 13.0% | 22.8% |
| Maximum | 70.8% | 92.0% |
| Range | 57.8% | 69.3% |
| Mean | 50.1% | 55.4% |
| Median | 52.9% | 56.7% |
| Interquartile 25% (IQ1) | 43.8% | 45.0% |
| Interquartile 75% (IQ3) | 58.7% | 63.2% |
| Interquartile Range (IQR) | 14.9% | 18.3% |
| Standard Deviation (Sample) | 11.6% | 13.4% |
| Standard Deviation (Population) | 11.5% | 13.3% |
Similar Demographics by College, 1 year or more
Demographics Similar to Immigrants from South Eastern Asia by College, 1 year or more
In terms of college, 1 year or more, the demographic groups most similar to Immigrants from South Eastern Asia are Slovak (58.5%, a difference of 0.040%), Immigrants from Thailand (58.6%, a difference of 0.070%), Spanish (58.5%, a difference of 0.070%), Dutch (58.6%, a difference of 0.080%), and Guamanian/Chamorro (58.6%, a difference of 0.080%).
| Demographics | Rating | Rank | College, 1 year or more |
| Immigrants | Philippines | 29.2 /100 | #191 | Fair 58.7% |
| Colombians | 27.6 /100 | #192 | Fair 58.7% |
| Peruvians | 27.5 /100 | #193 | Fair 58.6% |
| Costa Ricans | 26.4 /100 | #194 | Fair 58.6% |
| Dutch | 26.2 /100 | #195 | Fair 58.6% |
| Guamanians/Chamorros | 26.2 /100 | #196 | Fair 58.6% |
| Immigrants | Thailand | 26.0 /100 | #197 | Fair 58.6% |
| Immigrants | South Eastern Asia | 25.1 /100 | #198 | Fair 58.5% |
| Slovaks | 24.6 /100 | #199 | Fair 58.5% |
| Spanish | 24.2 /100 | #200 | Fair 58.5% |
| Nigerians | 23.0 /100 | #201 | Fair 58.5% |
| Immigrants | South America | 21.9 /100 | #202 | Fair 58.4% |
| Ghanaians | 20.9 /100 | #203 | Fair 58.4% |
| Panamanians | 19.2 /100 | #204 | Poor 58.3% |
| Immigrants | Zaire | 18.7 /100 | #205 | Poor 58.3% |
Demographics Similar to Vietnamese by College, 1 year or more
In terms of college, 1 year or more, the demographic groups most similar to Vietnamese are Immigrants from Western Africa (57.0%, a difference of 0.030%), Immigrants (57.0%, a difference of 0.090%), Portuguese (57.2%, a difference of 0.21%), Hmong (57.2%, a difference of 0.21%), and Immigrants from Fiji (56.9%, a difference of 0.24%).
| Demographics | Rating | Rank | College, 1 year or more |
| Native Hawaiians | 9.0 /100 | #218 | Tragic 57.6% |
| Whites/Caucasians | 8.7 /100 | #219 | Tragic 57.6% |
| Immigrants | Costa Rica | 8.0 /100 | #220 | Tragic 57.5% |
| Immigrants | Ghana | 7.7 /100 | #221 | Tragic 57.4% |
| Sub-Saharan Africans | 6.1 /100 | #222 | Tragic 57.3% |
| Portuguese | 5.4 /100 | #223 | Tragic 57.2% |
| Hmong | 5.4 /100 | #224 | Tragic 57.2% |
| Vietnamese | 4.7 /100 | #225 | Tragic 57.0% |
| Immigrants | Western Africa | 4.6 /100 | #226 | Tragic 57.0% |
| Immigrants | Immigrants | 4.4 /100 | #227 | Tragic 57.0% |
| Immigrants | Fiji | 4.0 /100 | #228 | Tragic 56.9% |
| Cree | 3.6 /100 | #229 | Tragic 56.8% |
| Liberians | 3.1 /100 | #230 | Tragic 56.7% |
| Immigrants | Burma/Myanmar | 2.7 /100 | #231 | Tragic 56.6% |
| Immigrants | Bangladesh | 2.6 /100 | #232 | Tragic 56.6% |