Immigrants from South Eastern Asia vs Apache Unemployment
COMPARE
Immigrants from South Eastern Asia
Apache
Unemployment
Unemployment Comparison
Immigrants from South Eastern Asia
Apache
5.3%
UNEMPLOYMENT
27.0/ 100
METRIC RATING
201st/ 347
METRIC RANK
7.4%
UNEMPLOYMENT
0.0/ 100
METRIC RATING
334th/ 347
METRIC RANK
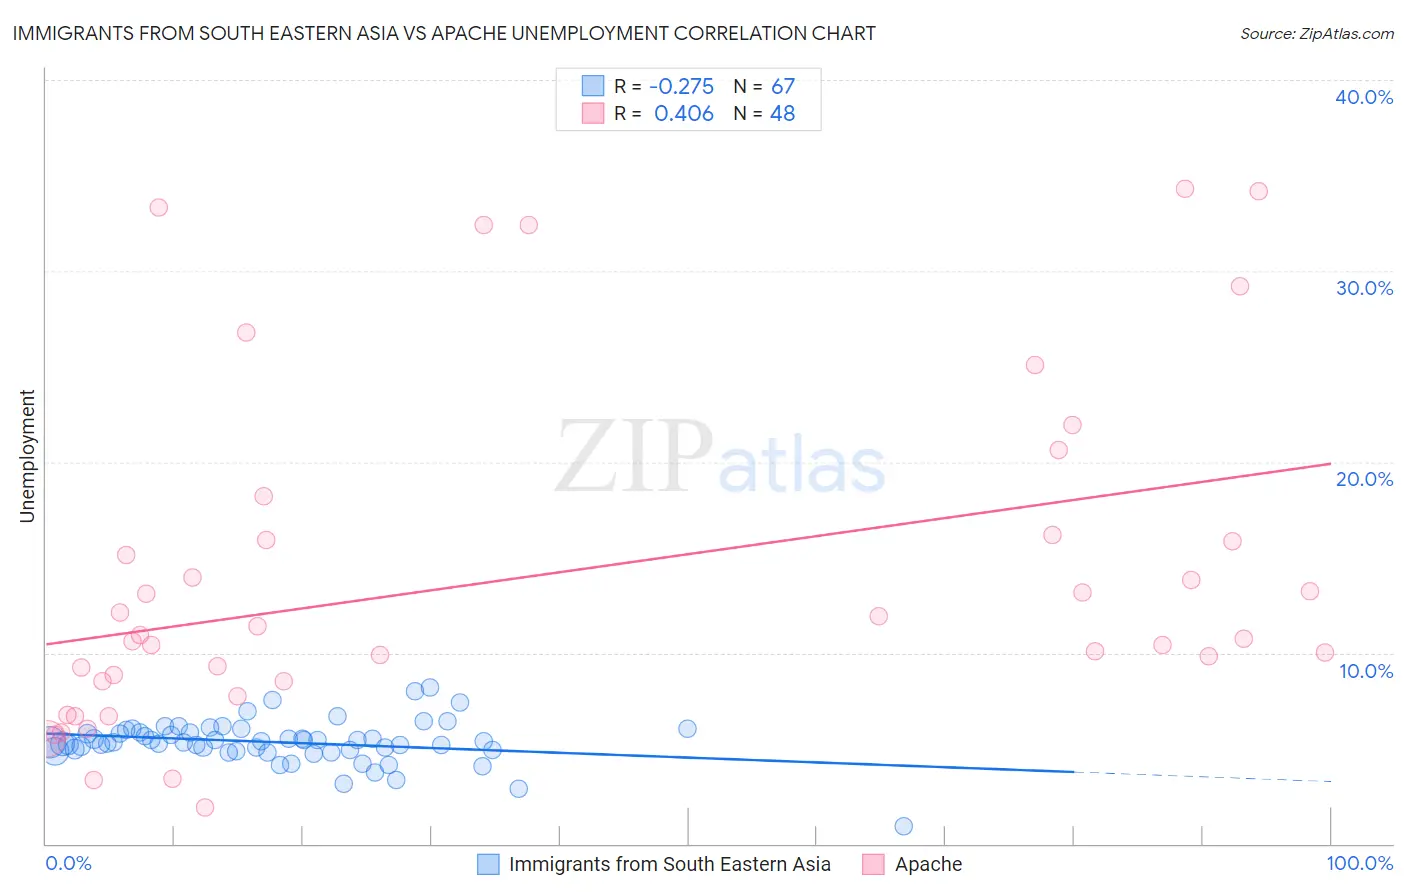
Immigrants from South Eastern Asia vs Apache Unemployment Correlation Chart
The statistical analysis conducted on geographies consisting of 511,484,497 people shows a weak negative correlation between the proportion of Immigrants from South Eastern Asia and unemployment in the United States with a correlation coefficient (R) of -0.275 and weighted average of 5.3%. Similarly, the statistical analysis conducted on geographies consisting of 230,935,623 people shows a moderate positive correlation between the proportion of Apache and unemployment in the United States with a correlation coefficient (R) of 0.406 and weighted average of 7.4%, a difference of 39.1%.
Unemployment Correlation Summary
| Measurement | Immigrants from South Eastern Asia | Apache |
| Minimum | 0.90% | 1.9% |
| Maximum | 8.2% | 34.3% |
| Range | 7.3% | 32.4% |
| Mean | 5.3% | 14.0% |
| Median | 5.3% | 10.8% |
| Interquartile 25% (IQ1) | 4.9% | 8.5% |
| Interquartile 75% (IQ3) | 5.8% | 16.0% |
| Interquartile Range (IQR) | 0.92% | 7.5% |
| Standard Deviation (Sample) | 1.1% | 8.8% |
| Standard Deviation (Population) | 1.1% | 8.7% |
Similar Demographics by Unemployment
Demographics Similar to Immigrants from South Eastern Asia by Unemployment
In terms of unemployment, the demographic groups most similar to Immigrants from South Eastern Asia are Korean (5.3%, a difference of 0.030%), Immigrants from Israel (5.3%, a difference of 0.12%), Immigrants from Afghanistan (5.3%, a difference of 0.12%), Cherokee (5.3%, a difference of 0.12%), and Immigrants from Micronesia (5.3%, a difference of 0.14%).
| Demographics | Rating | Rank | Unemployment |
| Immigrants | Laos | 30.9 /100 | #194 | Fair 5.3% |
| Immigrants | Southern Europe | 30.9 /100 | #195 | Fair 5.3% |
| Peruvians | 29.9 /100 | #196 | Fair 5.3% |
| Immigrants | Uruguay | 29.8 /100 | #197 | Fair 5.3% |
| Immigrants | Israel | 28.6 /100 | #198 | Fair 5.3% |
| Immigrants | Afghanistan | 28.6 /100 | #199 | Fair 5.3% |
| Koreans | 27.4 /100 | #200 | Fair 5.3% |
| Immigrants | South Eastern Asia | 27.0 /100 | #201 | Fair 5.3% |
| Cherokee | 25.5 /100 | #202 | Fair 5.3% |
| Immigrants | Micronesia | 25.2 /100 | #203 | Fair 5.3% |
| Immigrants | Ukraine | 24.9 /100 | #204 | Fair 5.3% |
| Native Hawaiians | 24.1 /100 | #205 | Fair 5.3% |
| Immigrants | Peru | 22.7 /100 | #206 | Fair 5.4% |
| Creek | 19.4 /100 | #207 | Poor 5.4% |
| Portuguese | 19.0 /100 | #208 | Poor 5.4% |
Demographics Similar to Apache by Unemployment
In terms of unemployment, the demographic groups most similar to Apache are Immigrants from Dominican Republic (7.4%, a difference of 0.47%), Sioux (7.4%, a difference of 0.53%), Dominican (7.4%, a difference of 0.95%), Yakama (7.3%, a difference of 1.3%), and Alaska Native (7.2%, a difference of 2.6%).
| Demographics | Rating | Rank | Unemployment |
| Pueblo | 0.0 /100 | #327 | Tragic 7.2% |
| Tsimshian | 0.0 /100 | #328 | Tragic 7.2% |
| Alaska Natives | 0.0 /100 | #329 | Tragic 7.2% |
| Yakama | 0.0 /100 | #330 | Tragic 7.3% |
| Dominicans | 0.0 /100 | #331 | Tragic 7.4% |
| Sioux | 0.0 /100 | #332 | Tragic 7.4% |
| Immigrants | Dominican Republic | 0.0 /100 | #333 | Tragic 7.4% |
| Apache | 0.0 /100 | #334 | Tragic 7.4% |
| Alaskan Athabascans | 0.0 /100 | #335 | Tragic 7.7% |
| Immigrants | Yemen | 0.0 /100 | #336 | Tragic 7.7% |
| Cheyenne | 0.0 /100 | #337 | Tragic 8.0% |
| Pima | 0.0 /100 | #338 | Tragic 8.2% |
| Navajo | 0.0 /100 | #339 | Tragic 8.4% |
| Puerto Ricans | 0.0 /100 | #340 | Tragic 8.4% |
| Tohono O'odham | 0.0 /100 | #341 | Tragic 8.9% |