Immigrants from Venezuela vs Immigrants from Guyana GED/Equivalency
COMPARE
Immigrants from Venezuela
Immigrants from Guyana
GED/Equivalency
GED/Equivalency Comparison
Immigrants from Venezuela
Immigrants from Guyana
85.8%
GED/EQUIVALENCY
50.7/ 100
METRIC RATING
173rd/ 347
METRIC RANK
81.0%
GED/EQUIVALENCY
0.0/ 100
METRIC RATING
310th/ 347
METRIC RANK
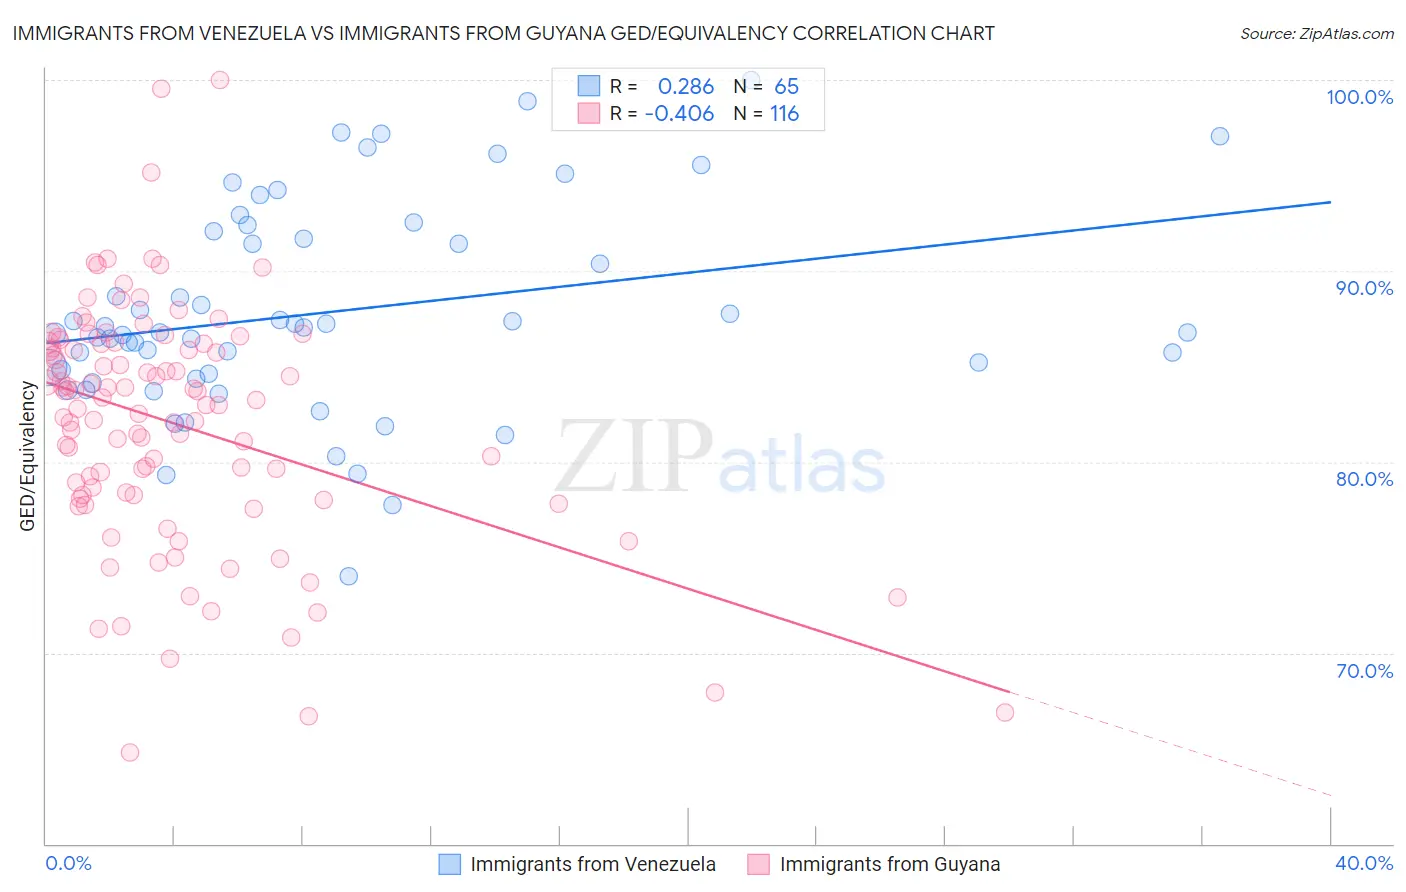
Immigrants from Venezuela vs Immigrants from Guyana GED/Equivalency Correlation Chart
The statistical analysis conducted on geographies consisting of 287,866,009 people shows a weak positive correlation between the proportion of Immigrants from Venezuela and percentage of population with at least ged/equivalency education in the United States with a correlation coefficient (R) of 0.286 and weighted average of 85.8%. Similarly, the statistical analysis conducted on geographies consisting of 183,746,342 people shows a moderate negative correlation between the proportion of Immigrants from Guyana and percentage of population with at least ged/equivalency education in the United States with a correlation coefficient (R) of -0.406 and weighted average of 81.0%, a difference of 5.9%.
GED/Equivalency Correlation Summary
| Measurement | Immigrants from Venezuela | Immigrants from Guyana |
| Minimum | 74.0% | 64.8% |
| Maximum | 100.0% | 100.0% |
| Range | 26.0% | 35.2% |
| Mean | 87.8% | 82.0% |
| Median | 86.8% | 83.1% |
| Interquartile 25% (IQ1) | 84.5% | 78.3% |
| Interquartile 75% (IQ3) | 91.9% | 86.2% |
| Interquartile Range (IQR) | 7.4% | 7.9% |
| Standard Deviation (Sample) | 5.4% | 6.3% |
| Standard Deviation (Population) | 5.4% | 6.2% |
Similar Demographics by GED/Equivalency
Demographics Similar to Immigrants from Venezuela by GED/Equivalency
In terms of ged/equivalency, the demographic groups most similar to Immigrants from Venezuela are Ottawa (85.8%, a difference of 0.010%), Immigrants from Bolivia (85.8%, a difference of 0.020%), Immigrants from Eastern Africa (85.7%, a difference of 0.060%), Bermudan (85.8%, a difference of 0.090%), and Immigrants from Uganda (85.7%, a difference of 0.11%).
| Demographics | Rating | Rank | GED/Equivalency |
| Immigrants | Albania | 64.2 /100 | #166 | Good 86.0% |
| Ethiopians | 63.7 /100 | #167 | Good 86.0% |
| Sierra Leoneans | 61.8 /100 | #168 | Good 86.0% |
| Immigrants | Ethiopia | 61.2 /100 | #169 | Good 86.0% |
| Afghans | 59.7 /100 | #170 | Average 85.9% |
| Immigrants | Chile | 57.3 /100 | #171 | Average 85.9% |
| Bermudans | 55.1 /100 | #172 | Average 85.8% |
| Immigrants | Venezuela | 50.7 /100 | #173 | Average 85.8% |
| Ottawa | 50.0 /100 | #174 | Average 85.8% |
| Immigrants | Bolivia | 49.8 /100 | #175 | Average 85.8% |
| Immigrants | Eastern Africa | 47.7 /100 | #176 | Average 85.7% |
| Immigrants | Uganda | 45.2 /100 | #177 | Average 85.7% |
| Koreans | 41.2 /100 | #178 | Average 85.6% |
| Aleuts | 40.5 /100 | #179 | Average 85.6% |
| Immigrants | Southern Europe | 38.4 /100 | #180 | Fair 85.5% |
Demographics Similar to Immigrants from Guyana by GED/Equivalency
In terms of ged/equivalency, the demographic groups most similar to Immigrants from Guyana are Native/Alaskan (80.9%, a difference of 0.0%), Nicaraguan (80.9%, a difference of 0.040%), Cape Verdean (80.9%, a difference of 0.040%), Immigrants from Ecuador (81.0%, a difference of 0.060%), and Belizean (80.9%, a difference of 0.060%).
| Demographics | Rating | Rank | GED/Equivalency |
| Immigrants | Portugal | 0.0 /100 | #303 | Tragic 81.6% |
| Navajo | 0.0 /100 | #304 | Tragic 81.5% |
| Immigrants | Grenada | 0.0 /100 | #305 | Tragic 81.3% |
| Guyanese | 0.0 /100 | #306 | Tragic 81.3% |
| Immigrants | Dominica | 0.0 /100 | #307 | Tragic 81.1% |
| Puerto Ricans | 0.0 /100 | #308 | Tragic 81.1% |
| Immigrants | Ecuador | 0.0 /100 | #309 | Tragic 81.0% |
| Immigrants | Guyana | 0.0 /100 | #310 | Tragic 81.0% |
| Natives/Alaskans | 0.0 /100 | #311 | Tragic 80.9% |
| Nicaraguans | 0.0 /100 | #312 | Tragic 80.9% |
| Cape Verdeans | 0.0 /100 | #313 | Tragic 80.9% |
| Belizeans | 0.0 /100 | #314 | Tragic 80.9% |
| Apache | 0.0 /100 | #315 | Tragic 80.7% |
| Central American Indians | 0.0 /100 | #316 | Tragic 80.6% |
| Immigrants | Caribbean | 0.0 /100 | #317 | Tragic 80.5% |