Immigrants vs Bahamian GED/Equivalency
COMPARE
Immigrants
Bahamian
GED/Equivalency
GED/Equivalency Comparison
Immigrants
Bahamians
82.6%
GED/EQUIVALENCY
0.1/ 100
METRIC RATING
282nd/ 347
METRIC RANK
83.6%
GED/EQUIVALENCY
0.8/ 100
METRIC RATING
252nd/ 347
METRIC RANK
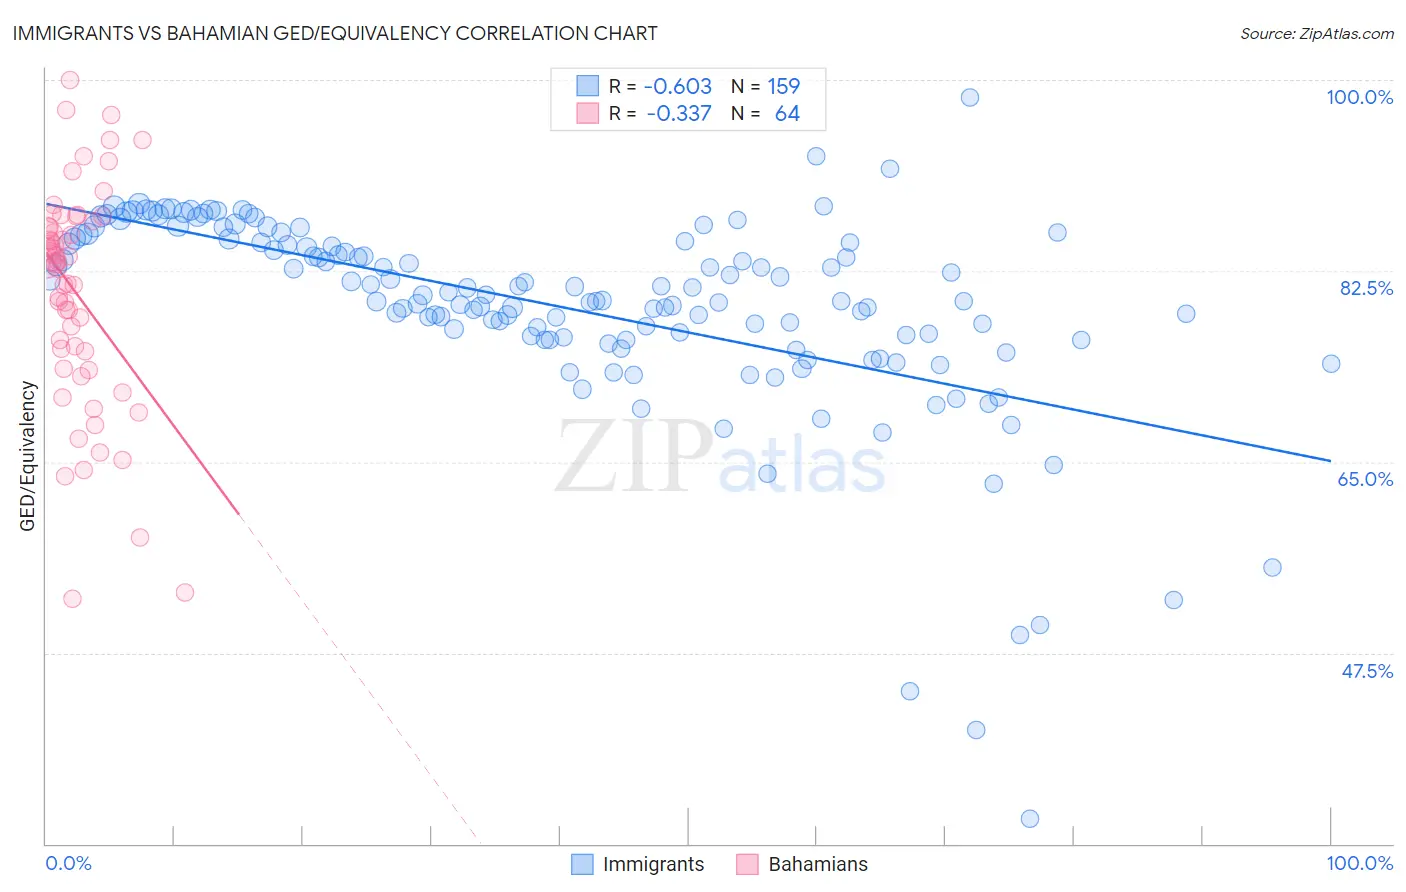
Immigrants vs Bahamian GED/Equivalency Correlation Chart
The statistical analysis conducted on geographies consisting of 577,784,417 people shows a significant negative correlation between the proportion of Immigrants and percentage of population with at least ged/equivalency education in the United States with a correlation coefficient (R) of -0.603 and weighted average of 82.6%. Similarly, the statistical analysis conducted on geographies consisting of 112,707,159 people shows a mild negative correlation between the proportion of Bahamians and percentage of population with at least ged/equivalency education in the United States with a correlation coefficient (R) of -0.337 and weighted average of 83.6%, a difference of 1.3%.
GED/Equivalency Correlation Summary
| Measurement | Immigrants | Bahamian |
| Minimum | 32.3% | 52.4% |
| Maximum | 98.4% | 100.0% |
| Range | 66.2% | 47.6% |
| Mean | 79.2% | 80.4% |
| Median | 80.3% | 83.2% |
| Interquartile 25% (IQ1) | 76.2% | 74.4% |
| Interquartile 75% (IQ3) | 85.2% | 86.8% |
| Interquartile Range (IQR) | 9.1% | 12.5% |
| Standard Deviation (Sample) | 9.4% | 10.2% |
| Standard Deviation (Population) | 9.4% | 10.1% |
Similar Demographics by GED/Equivalency
Demographics Similar to Immigrants by GED/Equivalency
In terms of ged/equivalency, the demographic groups most similar to Immigrants are Indonesian (82.5%, a difference of 0.050%), Sioux (82.6%, a difference of 0.090%), Immigrants from Barbados (82.4%, a difference of 0.16%), Cheyenne (82.7%, a difference of 0.18%), and Immigrants from Fiji (82.7%, a difference of 0.19%).
| Demographics | Rating | Rank | GED/Equivalency |
| Seminole | 0.1 /100 | #275 | Tragic 82.8% |
| Blacks/African Americans | 0.1 /100 | #276 | Tragic 82.8% |
| Arapaho | 0.1 /100 | #277 | Tragic 82.8% |
| Immigrants | Laos | 0.1 /100 | #278 | Tragic 82.7% |
| Immigrants | Fiji | 0.1 /100 | #279 | Tragic 82.7% |
| Cheyenne | 0.1 /100 | #280 | Tragic 82.7% |
| Sioux | 0.1 /100 | #281 | Tragic 82.6% |
| Immigrants | Immigrants | 0.1 /100 | #282 | Tragic 82.6% |
| Indonesians | 0.1 /100 | #283 | Tragic 82.5% |
| Immigrants | Barbados | 0.1 /100 | #284 | Tragic 82.4% |
| Cajuns | 0.0 /100 | #285 | Tragic 82.4% |
| Immigrants | West Indies | 0.0 /100 | #286 | Tragic 82.4% |
| Japanese | 0.0 /100 | #287 | Tragic 82.4% |
| Pueblo | 0.0 /100 | #288 | Tragic 82.3% |
| Immigrants | Cambodia | 0.0 /100 | #289 | Tragic 82.2% |
Demographics Similar to Bahamians by GED/Equivalency
In terms of ged/equivalency, the demographic groups most similar to Bahamians are Spanish American (83.6%, a difference of 0.0%), Comanche (83.6%, a difference of 0.060%), Creek (83.6%, a difference of 0.090%), Shoshone (83.7%, a difference of 0.15%), and Blackfeet (83.8%, a difference of 0.17%).
| Demographics | Rating | Rank | GED/Equivalency |
| Immigrants | Senegal | 1.2 /100 | #245 | Tragic 83.8% |
| Chickasaw | 1.2 /100 | #246 | Tragic 83.8% |
| Immigrants | Western Africa | 1.1 /100 | #247 | Tragic 83.8% |
| Blackfeet | 1.1 /100 | #248 | Tragic 83.8% |
| Crow | 1.1 /100 | #249 | Tragic 83.8% |
| Shoshone | 1.0 /100 | #250 | Tragic 83.7% |
| Spanish Americans | 0.8 /100 | #251 | Tragic 83.6% |
| Bahamians | 0.8 /100 | #252 | Tragic 83.6% |
| Comanche | 0.7 /100 | #253 | Tragic 83.6% |
| Creek | 0.7 /100 | #254 | Tragic 83.6% |
| Colville | 0.5 /100 | #255 | Tragic 83.4% |
| Africans | 0.5 /100 | #256 | Tragic 83.4% |
| Jamaicans | 0.4 /100 | #257 | Tragic 83.3% |
| Malaysians | 0.4 /100 | #258 | Tragic 83.3% |
| Immigrants | Vietnam | 0.3 /100 | #259 | Tragic 83.2% |