Immigrants from Burma/Myanmar vs Bahamian GED/Equivalency
COMPARE
Immigrants from Burma/Myanmar
Bahamian
GED/Equivalency
GED/Equivalency Comparison
Immigrants from Burma/Myanmar
Bahamians
83.0%
GED/EQUIVALENCY
0.2/ 100
METRIC RATING
268th/ 347
METRIC RANK
83.6%
GED/EQUIVALENCY
0.8/ 100
METRIC RATING
252nd/ 347
METRIC RANK
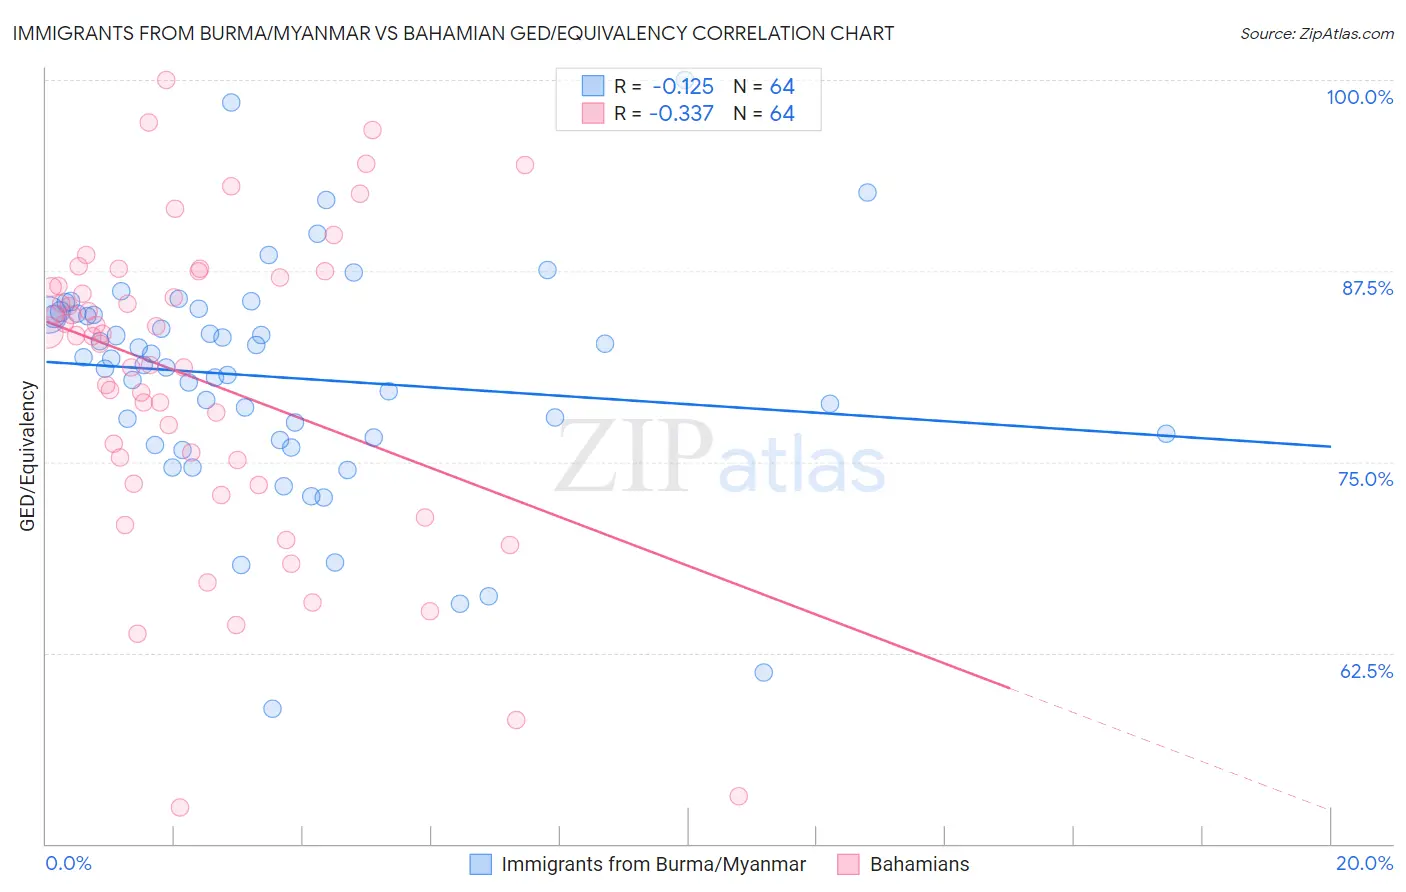
Immigrants from Burma/Myanmar vs Bahamian GED/Equivalency Correlation Chart
The statistical analysis conducted on geographies consisting of 172,357,706 people shows a poor negative correlation between the proportion of Immigrants from Burma/Myanmar and percentage of population with at least ged/equivalency education in the United States with a correlation coefficient (R) of -0.125 and weighted average of 83.0%. Similarly, the statistical analysis conducted on geographies consisting of 112,707,159 people shows a mild negative correlation between the proportion of Bahamians and percentage of population with at least ged/equivalency education in the United States with a correlation coefficient (R) of -0.337 and weighted average of 83.6%, a difference of 0.75%.
GED/Equivalency Correlation Summary
| Measurement | Immigrants from Burma/Myanmar | Bahamian |
| Minimum | 58.8% | 52.4% |
| Maximum | 100.0% | 100.0% |
| Range | 41.2% | 47.6% |
| Mean | 80.5% | 80.4% |
| Median | 81.5% | 83.2% |
| Interquartile 25% (IQ1) | 76.5% | 74.4% |
| Interquartile 75% (IQ3) | 84.7% | 86.8% |
| Interquartile Range (IQR) | 8.1% | 12.5% |
| Standard Deviation (Sample) | 7.5% | 10.2% |
| Standard Deviation (Population) | 7.4% | 10.1% |
Demographics Similar to Immigrants from Burma/Myanmar and Bahamians by GED/Equivalency
In terms of ged/equivalency, the demographic groups most similar to Immigrants from Burma/Myanmar are Trinidadian and Tobagonian (83.0%, a difference of 0.040%), Hopi (83.0%, a difference of 0.040%), West Indian (83.1%, a difference of 0.060%), Kiowa (83.1%, a difference of 0.060%), and Bangladeshi (83.1%, a difference of 0.070%). Similarly, the demographic groups most similar to Bahamians are Spanish American (83.6%, a difference of 0.0%), Comanche (83.6%, a difference of 0.060%), Creek (83.6%, a difference of 0.090%), Shoshone (83.7%, a difference of 0.15%), and Colville (83.4%, a difference of 0.26%).
| Demographics | Rating | Rank | GED/Equivalency |
| Shoshone | 1.0 /100 | #250 | Tragic 83.7% |
| Spanish Americans | 0.8 /100 | #251 | Tragic 83.6% |
| Bahamians | 0.8 /100 | #252 | Tragic 83.6% |
| Comanche | 0.7 /100 | #253 | Tragic 83.6% |
| Creek | 0.7 /100 | #254 | Tragic 83.6% |
| Colville | 0.5 /100 | #255 | Tragic 83.4% |
| Africans | 0.5 /100 | #256 | Tragic 83.4% |
| Jamaicans | 0.4 /100 | #257 | Tragic 83.3% |
| Malaysians | 0.4 /100 | #258 | Tragic 83.3% |
| Immigrants | Vietnam | 0.3 /100 | #259 | Tragic 83.2% |
| Choctaw | 0.3 /100 | #260 | Tragic 83.1% |
| Inupiat | 0.2 /100 | #261 | Tragic 83.1% |
| Immigrants | Armenia | 0.2 /100 | #262 | Tragic 83.1% |
| Immigrants | Congo | 0.2 /100 | #263 | Tragic 83.1% |
| Bangladeshis | 0.2 /100 | #264 | Tragic 83.1% |
| West Indians | 0.2 /100 | #265 | Tragic 83.1% |
| Kiowa | 0.2 /100 | #266 | Tragic 83.1% |
| Trinidadians and Tobagonians | 0.2 /100 | #267 | Tragic 83.0% |
| Immigrants | Burma/Myanmar | 0.2 /100 | #268 | Tragic 83.0% |
| Hopi | 0.2 /100 | #269 | Tragic 83.0% |
| Immigrants | Jamaica | 0.2 /100 | #270 | Tragic 82.9% |