Immigrants from Northern Africa vs Arapaho College, Under 1 year
COMPARE
Immigrants from Northern Africa
Arapaho
College, Under 1 year
College, Under 1 year Comparison
Immigrants from Northern Africa
Arapaho
67.2%
COLLEGE, UNDER 1 YEAR
92.7/ 100
METRIC RATING
123rd/ 347
METRIC RANK
60.3%
COLLEGE, UNDER 1 YEAR
0.1/ 100
METRIC RATING
276th/ 347
METRIC RANK
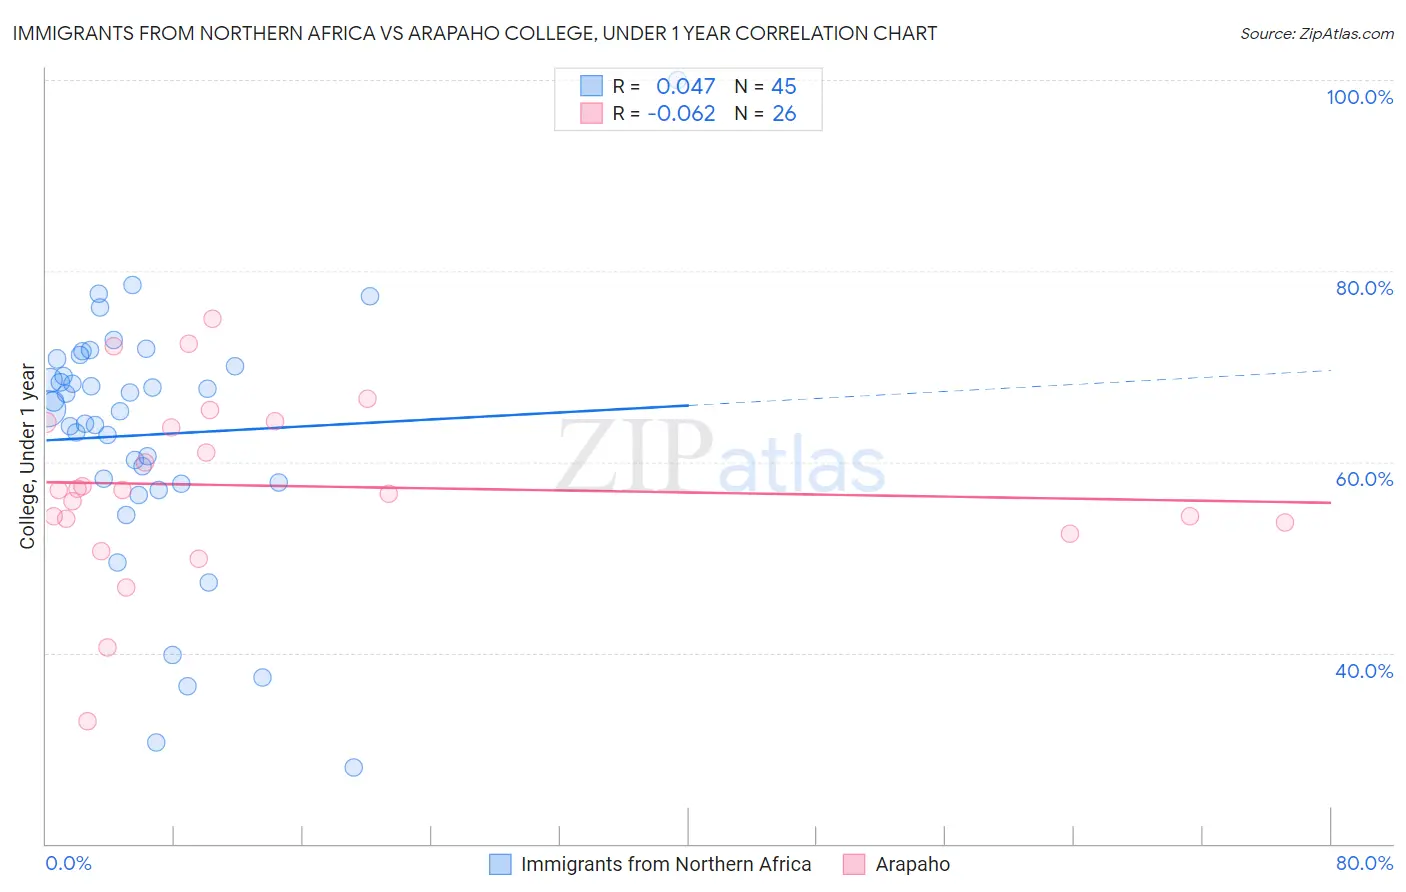
Immigrants from Northern Africa vs Arapaho College, Under 1 year Correlation Chart
The statistical analysis conducted on geographies consisting of 321,198,131 people shows no correlation between the proportion of Immigrants from Northern Africa and percentage of population with at least college, under 1 year education in the United States with a correlation coefficient (R) of 0.047 and weighted average of 67.2%. Similarly, the statistical analysis conducted on geographies consisting of 29,780,040 people shows a slight negative correlation between the proportion of Arapaho and percentage of population with at least college, under 1 year education in the United States with a correlation coefficient (R) of -0.062 and weighted average of 60.3%, a difference of 11.4%.
College, Under 1 year Correlation Summary
| Measurement | Immigrants from Northern Africa | Arapaho |
| Minimum | 28.0% | 32.8% |
| Maximum | 100.0% | 75.0% |
| Range | 72.0% | 42.2% |
| Mean | 62.8% | 57.5% |
| Median | 65.6% | 57.1% |
| Interquartile 25% (IQ1) | 57.7% | 53.7% |
| Interquartile 75% (IQ3) | 70.4% | 64.1% |
| Interquartile Range (IQR) | 12.7% | 10.4% |
| Standard Deviation (Sample) | 13.3% | 9.4% |
| Standard Deviation (Population) | 13.2% | 9.3% |
Similar Demographics by College, Under 1 year
Demographics Similar to Immigrants from Northern Africa by College, Under 1 year
In terms of college, under 1 year, the demographic groups most similar to Immigrants from Northern Africa are Arab (67.2%, a difference of 0.010%), Immigrants from Jordan (67.3%, a difference of 0.020%), Slovene (67.3%, a difference of 0.11%), Italian (67.2%, a difference of 0.13%), and Alsatian (67.1%, a difference of 0.19%).
| Demographics | Rating | Rank | College, Under 1 year |
| Immigrants | Nepal | 94.9 /100 | #116 | Exceptional 67.5% |
| Pakistanis | 94.8 /100 | #117 | Exceptional 67.5% |
| Immigrants | Ukraine | 94.7 /100 | #118 | Exceptional 67.5% |
| Lebanese | 94.6 /100 | #119 | Exceptional 67.5% |
| Serbians | 93.9 /100 | #120 | Exceptional 67.4% |
| Slovenes | 93.3 /100 | #121 | Exceptional 67.3% |
| Immigrants | Jordan | 92.8 /100 | #122 | Exceptional 67.3% |
| Immigrants | Northern Africa | 92.7 /100 | #123 | Exceptional 67.2% |
| Arabs | 92.6 /100 | #124 | Exceptional 67.2% |
| Italians | 91.8 /100 | #125 | Exceptional 67.2% |
| Alsatians | 91.3 /100 | #126 | Exceptional 67.1% |
| Czechs | 90.8 /100 | #127 | Exceptional 67.1% |
| Scottish | 90.2 /100 | #128 | Exceptional 67.0% |
| Immigrants | Eastern Africa | 89.5 /100 | #129 | Excellent 67.0% |
| Immigrants | Syria | 89.0 /100 | #130 | Excellent 66.9% |
Demographics Similar to Arapaho by College, Under 1 year
In terms of college, under 1 year, the demographic groups most similar to Arapaho are Immigrants from Barbados (60.4%, a difference of 0.030%), Bahamian (60.3%, a difference of 0.14%), Chickasaw (60.4%, a difference of 0.16%), Alaska Native (60.4%, a difference of 0.16%), and Yaqui (60.2%, a difference of 0.17%).
| Demographics | Rating | Rank | College, Under 1 year |
| Immigrants | West Indies | 0.1 /100 | #269 | Tragic 60.6% |
| Cheyenne | 0.1 /100 | #270 | Tragic 60.6% |
| U.S. Virgin Islanders | 0.1 /100 | #271 | Tragic 60.6% |
| Jamaicans | 0.1 /100 | #272 | Tragic 60.5% |
| Chickasaw | 0.1 /100 | #273 | Tragic 60.4% |
| Alaska Natives | 0.1 /100 | #274 | Tragic 60.4% |
| Immigrants | Barbados | 0.1 /100 | #275 | Tragic 60.4% |
| Arapaho | 0.1 /100 | #276 | Tragic 60.3% |
| Bahamians | 0.1 /100 | #277 | Tragic 60.3% |
| Yaqui | 0.1 /100 | #278 | Tragic 60.2% |
| Ute | 0.1 /100 | #279 | Tragic 60.2% |
| Crow | 0.1 /100 | #280 | Tragic 60.2% |
| Cherokee | 0.1 /100 | #281 | Tragic 60.1% |
| Belizeans | 0.1 /100 | #282 | Tragic 60.1% |
| Immigrants | Jamaica | 0.0 /100 | #283 | Tragic 59.7% |