Immigrants from Northern Africa vs Hungarian College, Under 1 year
COMPARE
Immigrants from Northern Africa
Hungarian
College, Under 1 year
College, Under 1 year Comparison
Immigrants from Northern Africa
Hungarians
67.2%
COLLEGE, UNDER 1 YEAR
92.7/ 100
METRIC RATING
123rd/ 347
METRIC RANK
65.6%
COLLEGE, UNDER 1 YEAR
55.9/ 100
METRIC RATING
168th/ 347
METRIC RANK
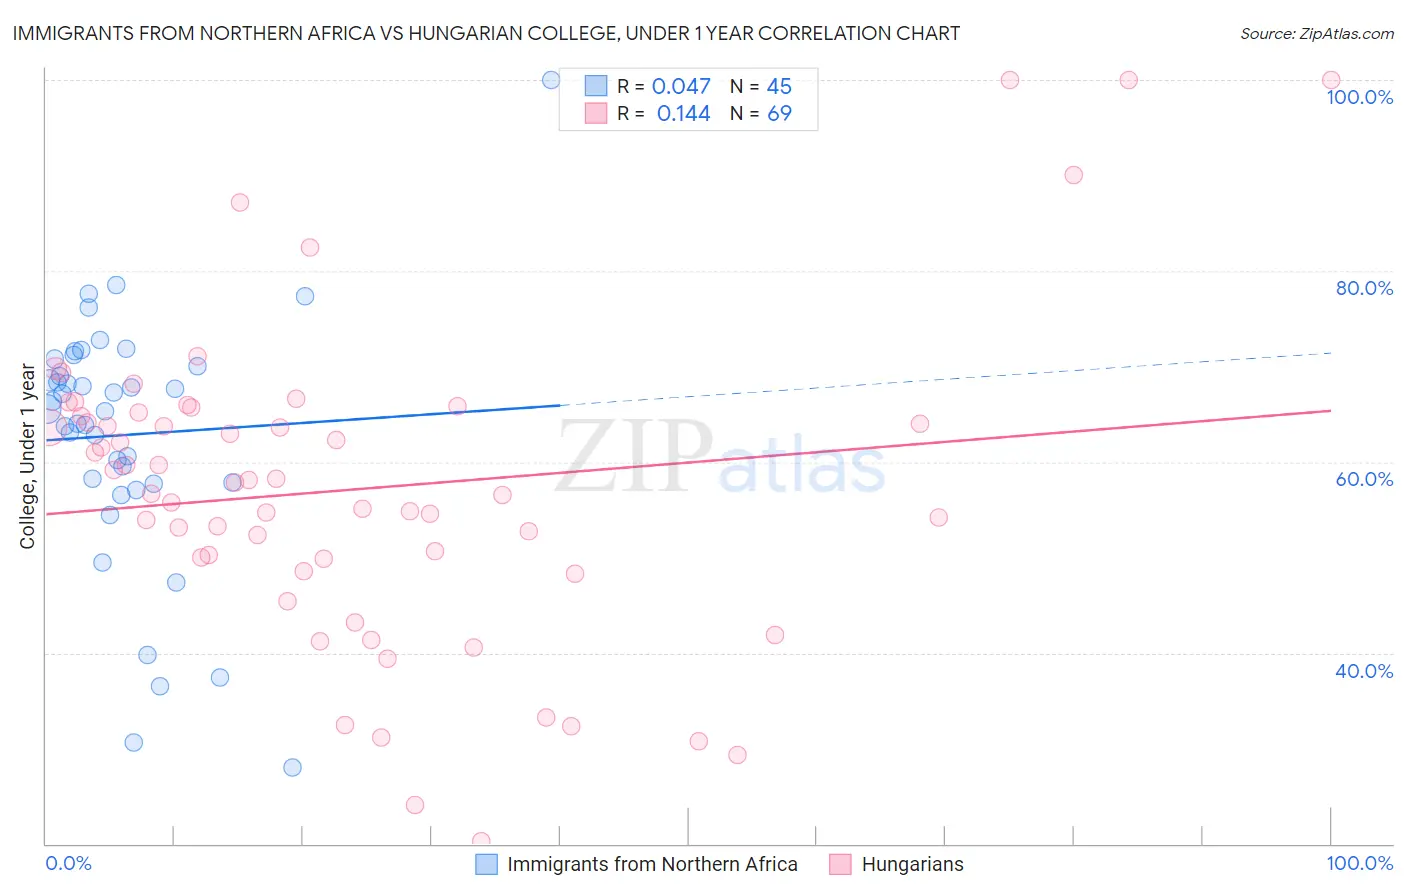
Immigrants from Northern Africa vs Hungarian College, Under 1 year Correlation Chart
The statistical analysis conducted on geographies consisting of 321,198,131 people shows no correlation between the proportion of Immigrants from Northern Africa and percentage of population with at least college, under 1 year education in the United States with a correlation coefficient (R) of 0.047 and weighted average of 67.2%. Similarly, the statistical analysis conducted on geographies consisting of 486,238,564 people shows a poor positive correlation between the proportion of Hungarians and percentage of population with at least college, under 1 year education in the United States with a correlation coefficient (R) of 0.144 and weighted average of 65.6%, a difference of 2.5%.
College, Under 1 year Correlation Summary
| Measurement | Immigrants from Northern Africa | Hungarian |
| Minimum | 28.0% | 20.2% |
| Maximum | 100.0% | 100.0% |
| Range | 72.0% | 79.8% |
| Mean | 62.8% | 57.1% |
| Median | 65.6% | 57.8% |
| Interquartile 25% (IQ1) | 57.7% | 49.2% |
| Interquartile 75% (IQ3) | 70.4% | 65.0% |
| Interquartile Range (IQR) | 12.7% | 15.8% |
| Standard Deviation (Sample) | 13.3% | 16.4% |
| Standard Deviation (Population) | 13.2% | 16.3% |
Similar Demographics by College, Under 1 year
Demographics Similar to Immigrants from Northern Africa by College, Under 1 year
In terms of college, under 1 year, the demographic groups most similar to Immigrants from Northern Africa are Arab (67.2%, a difference of 0.010%), Immigrants from Jordan (67.3%, a difference of 0.020%), Slovene (67.3%, a difference of 0.11%), Italian (67.2%, a difference of 0.13%), and Alsatian (67.1%, a difference of 0.19%).
| Demographics | Rating | Rank | College, Under 1 year |
| Immigrants | Nepal | 94.9 /100 | #116 | Exceptional 67.5% |
| Pakistanis | 94.8 /100 | #117 | Exceptional 67.5% |
| Immigrants | Ukraine | 94.7 /100 | #118 | Exceptional 67.5% |
| Lebanese | 94.6 /100 | #119 | Exceptional 67.5% |
| Serbians | 93.9 /100 | #120 | Exceptional 67.4% |
| Slovenes | 93.3 /100 | #121 | Exceptional 67.3% |
| Immigrants | Jordan | 92.8 /100 | #122 | Exceptional 67.3% |
| Immigrants | Northern Africa | 92.7 /100 | #123 | Exceptional 67.2% |
| Arabs | 92.6 /100 | #124 | Exceptional 67.2% |
| Italians | 91.8 /100 | #125 | Exceptional 67.2% |
| Alsatians | 91.3 /100 | #126 | Exceptional 67.1% |
| Czechs | 90.8 /100 | #127 | Exceptional 67.1% |
| Scottish | 90.2 /100 | #128 | Exceptional 67.0% |
| Immigrants | Eastern Africa | 89.5 /100 | #129 | Excellent 67.0% |
| Immigrants | Syria | 89.0 /100 | #130 | Excellent 66.9% |
Demographics Similar to Hungarians by College, Under 1 year
In terms of college, under 1 year, the demographic groups most similar to Hungarians are Yugoslavian (65.6%, a difference of 0.010%), German (65.6%, a difference of 0.010%), Immigrants from Somalia (65.6%, a difference of 0.020%), Moroccan (65.6%, a difference of 0.030%), and Immigrants from Oceania (65.6%, a difference of 0.040%).
| Demographics | Rating | Rank | College, Under 1 year |
| Brazilians | 66.0 /100 | #161 | Good 65.9% |
| Koreans | 65.3 /100 | #162 | Good 65.9% |
| Somalis | 62.7 /100 | #163 | Good 65.8% |
| Czechoslovakians | 62.6 /100 | #164 | Good 65.8% |
| Immigrants | Uzbekistan | 61.6 /100 | #165 | Good 65.8% |
| Moroccans | 56.7 /100 | #166 | Average 65.6% |
| Immigrants | Somalia | 56.4 /100 | #167 | Average 65.6% |
| Hungarians | 55.9 /100 | #168 | Average 65.6% |
| Yugoslavians | 55.7 /100 | #169 | Average 65.6% |
| Germans | 55.7 /100 | #170 | Average 65.6% |
| Immigrants | Oceania | 55.0 /100 | #171 | Average 65.6% |
| South American Indians | 54.4 /100 | #172 | Average 65.5% |
| Swiss | 53.9 /100 | #173 | Average 65.5% |
| Immigrants | Bosnia and Herzegovina | 50.0 /100 | #174 | Average 65.4% |
| Scotch-Irish | 49.5 /100 | #175 | Average 65.4% |