Immigrants from Eritrea vs Arapaho College, Under 1 year
COMPARE
Immigrants from Eritrea
Arapaho
College, Under 1 year
College, Under 1 year Comparison
Immigrants from Eritrea
Arapaho
66.1%
COLLEGE, UNDER 1 YEAR
71.9/ 100
METRIC RATING
154th/ 347
METRIC RANK
60.3%
COLLEGE, UNDER 1 YEAR
0.1/ 100
METRIC RATING
276th/ 347
METRIC RANK
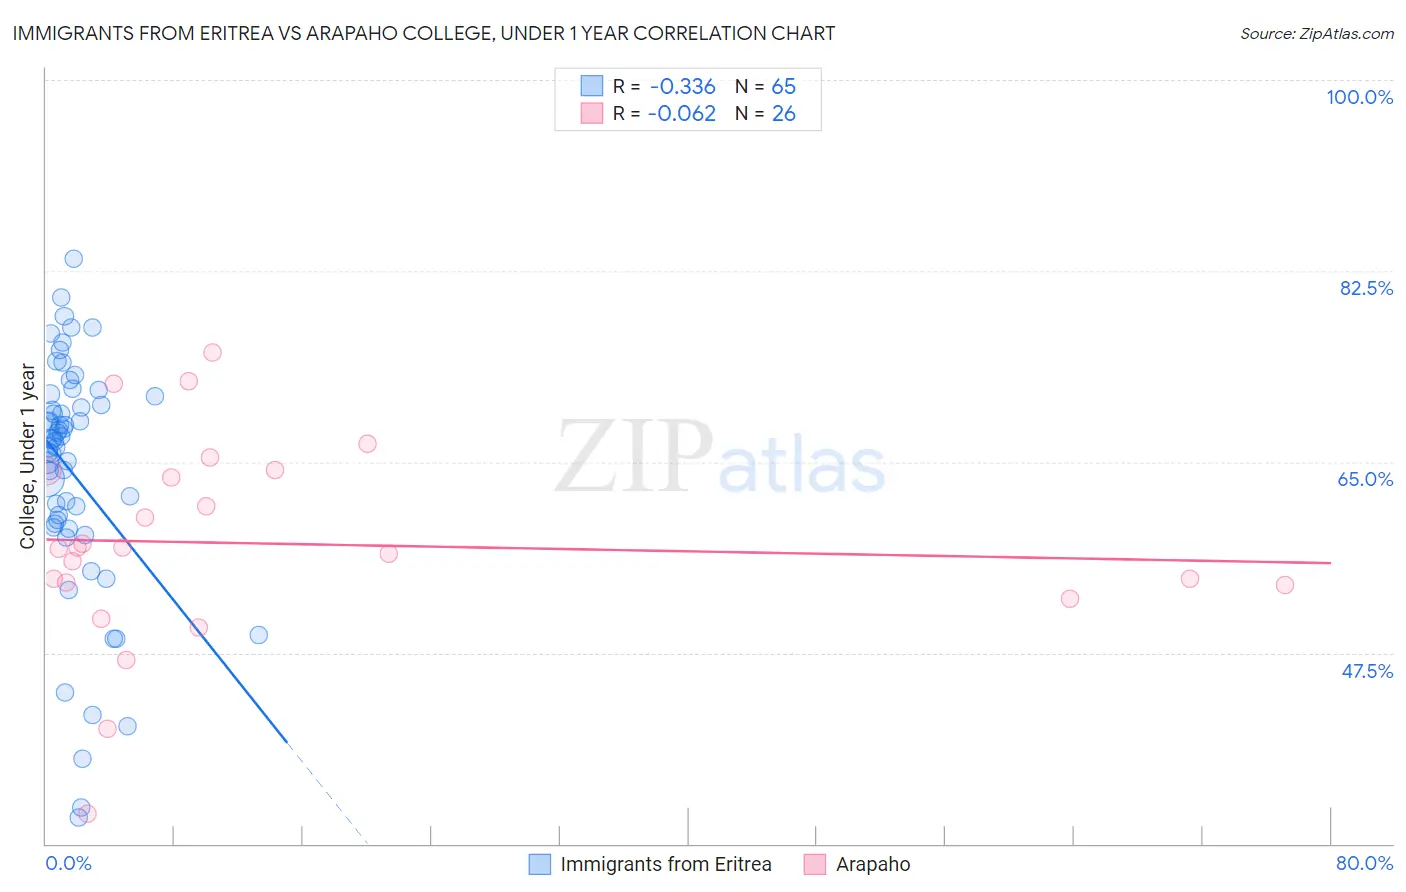
Immigrants from Eritrea vs Arapaho College, Under 1 year Correlation Chart
The statistical analysis conducted on geographies consisting of 104,852,201 people shows a mild negative correlation between the proportion of Immigrants from Eritrea and percentage of population with at least college, under 1 year education in the United States with a correlation coefficient (R) of -0.336 and weighted average of 66.1%. Similarly, the statistical analysis conducted on geographies consisting of 29,780,040 people shows a slight negative correlation between the proportion of Arapaho and percentage of population with at least college, under 1 year education in the United States with a correlation coefficient (R) of -0.062 and weighted average of 60.3%, a difference of 9.5%.
College, Under 1 year Correlation Summary
| Measurement | Immigrants from Eritrea | Arapaho |
| Minimum | 32.4% | 32.8% |
| Maximum | 83.6% | 75.0% |
| Range | 51.2% | 42.2% |
| Mean | 63.9% | 57.5% |
| Median | 66.9% | 57.1% |
| Interquartile 25% (IQ1) | 59.2% | 53.7% |
| Interquartile 75% (IQ3) | 70.6% | 64.1% |
| Interquartile Range (IQR) | 11.4% | 10.4% |
| Standard Deviation (Sample) | 11.1% | 9.4% |
| Standard Deviation (Population) | 11.0% | 9.3% |
Similar Demographics by College, Under 1 year
Demographics Similar to Immigrants from Eritrea by College, Under 1 year
In terms of college, under 1 year, the demographic groups most similar to Immigrants from Eritrea are Irish (66.0%, a difference of 0.090%), Belgian (66.2%, a difference of 0.10%), Welsh (66.0%, a difference of 0.11%), Sudanese (66.2%, a difference of 0.12%), and Sierra Leonean (66.0%, a difference of 0.21%).
| Demographics | Rating | Rank | College, Under 1 year |
| Immigrants | Morocco | 81.7 /100 | #147 | Excellent 66.5% |
| Taiwanese | 78.6 /100 | #148 | Good 66.4% |
| Immigrants | Venezuela | 77.9 /100 | #149 | Good 66.3% |
| Immigrants | Iraq | 77.1 /100 | #150 | Good 66.3% |
| Immigrants | Sudan | 76.0 /100 | #151 | Good 66.2% |
| Sudanese | 74.1 /100 | #152 | Good 66.2% |
| Belgians | 73.7 /100 | #153 | Good 66.2% |
| Immigrants | Eritrea | 71.9 /100 | #154 | Good 66.1% |
| Irish | 70.3 /100 | #155 | Good 66.0% |
| Welsh | 69.9 /100 | #156 | Good 66.0% |
| Sierra Leoneans | 67.8 /100 | #157 | Good 66.0% |
| Celtics | 67.3 /100 | #158 | Good 65.9% |
| Tlingit-Haida | 66.4 /100 | #159 | Good 65.9% |
| Albanians | 66.1 /100 | #160 | Good 65.9% |
| Brazilians | 66.0 /100 | #161 | Good 65.9% |
Demographics Similar to Arapaho by College, Under 1 year
In terms of college, under 1 year, the demographic groups most similar to Arapaho are Immigrants from Barbados (60.4%, a difference of 0.030%), Bahamian (60.3%, a difference of 0.14%), Chickasaw (60.4%, a difference of 0.16%), Alaska Native (60.4%, a difference of 0.16%), and Yaqui (60.2%, a difference of 0.17%).
| Demographics | Rating | Rank | College, Under 1 year |
| Immigrants | West Indies | 0.1 /100 | #269 | Tragic 60.6% |
| Cheyenne | 0.1 /100 | #270 | Tragic 60.6% |
| U.S. Virgin Islanders | 0.1 /100 | #271 | Tragic 60.6% |
| Jamaicans | 0.1 /100 | #272 | Tragic 60.5% |
| Chickasaw | 0.1 /100 | #273 | Tragic 60.4% |
| Alaska Natives | 0.1 /100 | #274 | Tragic 60.4% |
| Immigrants | Barbados | 0.1 /100 | #275 | Tragic 60.4% |
| Arapaho | 0.1 /100 | #276 | Tragic 60.3% |
| Bahamians | 0.1 /100 | #277 | Tragic 60.3% |
| Yaqui | 0.1 /100 | #278 | Tragic 60.2% |
| Ute | 0.1 /100 | #279 | Tragic 60.2% |
| Crow | 0.1 /100 | #280 | Tragic 60.2% |
| Cherokee | 0.1 /100 | #281 | Tragic 60.1% |
| Belizeans | 0.1 /100 | #282 | Tragic 60.1% |
| Immigrants | Jamaica | 0.0 /100 | #283 | Tragic 59.7% |