Immigrants from Northern Africa vs Immigrants from Lithuania College, Under 1 year
COMPARE
Immigrants from Northern Africa
Immigrants from Lithuania
College, Under 1 year
College, Under 1 year Comparison
Immigrants from Northern Africa
Immigrants from Lithuania
67.2%
COLLEGE, UNDER 1 YEAR
92.7/ 100
METRIC RATING
123rd/ 347
METRIC RANK
70.3%
COLLEGE, UNDER 1 YEAR
99.9/ 100
METRIC RATING
42nd/ 347
METRIC RANK
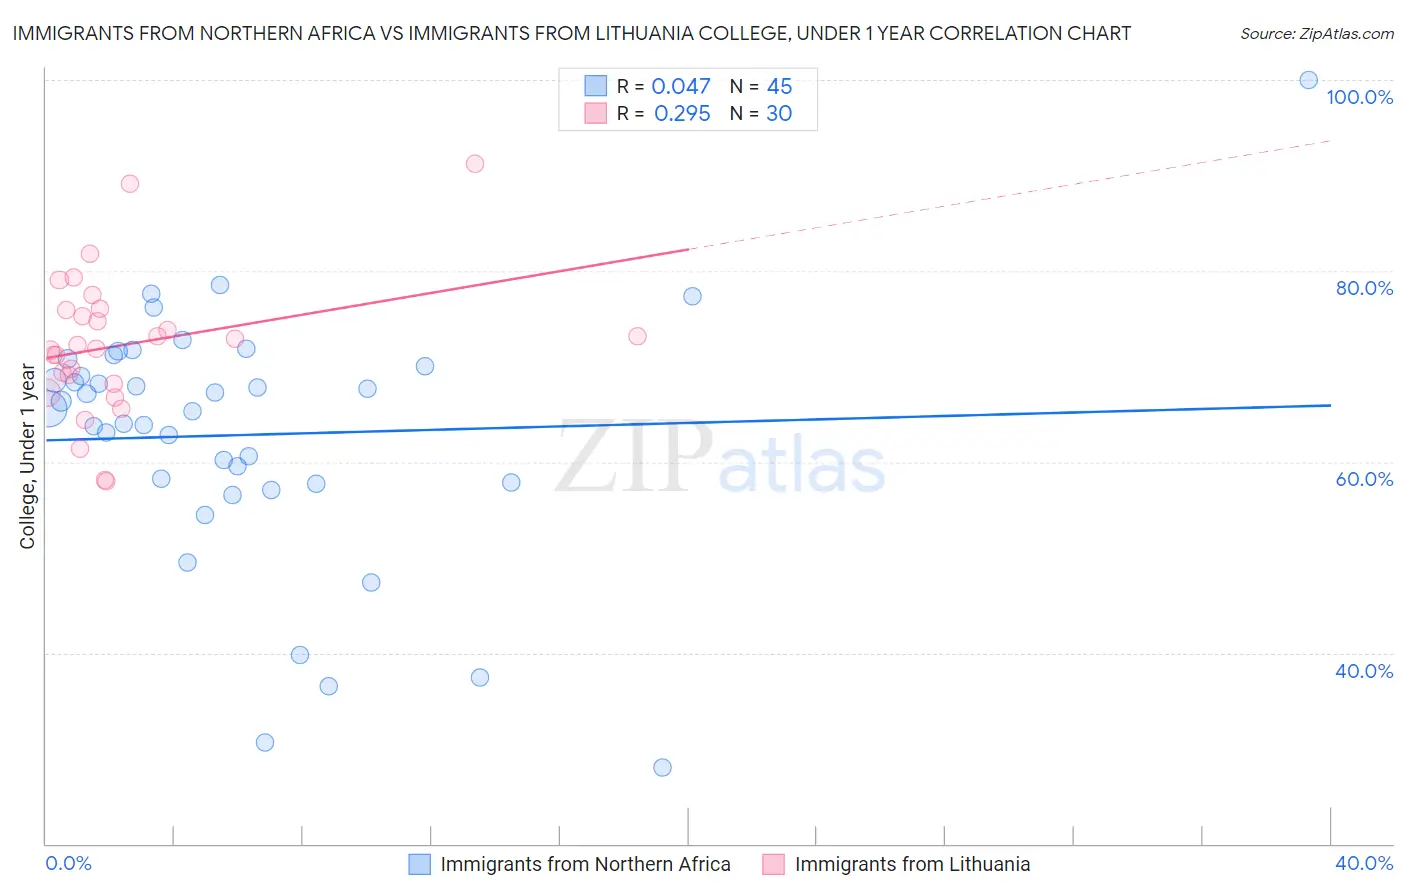
Immigrants from Northern Africa vs Immigrants from Lithuania College, Under 1 year Correlation Chart
The statistical analysis conducted on geographies consisting of 321,198,131 people shows no correlation between the proportion of Immigrants from Northern Africa and percentage of population with at least college, under 1 year education in the United States with a correlation coefficient (R) of 0.047 and weighted average of 67.2%. Similarly, the statistical analysis conducted on geographies consisting of 117,724,932 people shows a weak positive correlation between the proportion of Immigrants from Lithuania and percentage of population with at least college, under 1 year education in the United States with a correlation coefficient (R) of 0.295 and weighted average of 70.3%, a difference of 4.5%.
College, Under 1 year Correlation Summary
| Measurement | Immigrants from Northern Africa | Immigrants from Lithuania |
| Minimum | 28.0% | 57.9% |
| Maximum | 100.0% | 91.2% |
| Range | 72.0% | 33.3% |
| Mean | 62.8% | 72.3% |
| Median | 65.6% | 72.1% |
| Interquartile 25% (IQ1) | 57.7% | 68.2% |
| Interquartile 75% (IQ3) | 70.4% | 76.0% |
| Interquartile Range (IQR) | 12.7% | 7.8% |
| Standard Deviation (Sample) | 13.3% | 7.5% |
| Standard Deviation (Population) | 13.2% | 7.4% |
Similar Demographics by College, Under 1 year
Demographics Similar to Immigrants from Northern Africa by College, Under 1 year
In terms of college, under 1 year, the demographic groups most similar to Immigrants from Northern Africa are Arab (67.2%, a difference of 0.010%), Immigrants from Jordan (67.3%, a difference of 0.020%), Slovene (67.3%, a difference of 0.11%), Italian (67.2%, a difference of 0.13%), and Alsatian (67.1%, a difference of 0.19%).
| Demographics | Rating | Rank | College, Under 1 year |
| Immigrants | Nepal | 94.9 /100 | #116 | Exceptional 67.5% |
| Pakistanis | 94.8 /100 | #117 | Exceptional 67.5% |
| Immigrants | Ukraine | 94.7 /100 | #118 | Exceptional 67.5% |
| Lebanese | 94.6 /100 | #119 | Exceptional 67.5% |
| Serbians | 93.9 /100 | #120 | Exceptional 67.4% |
| Slovenes | 93.3 /100 | #121 | Exceptional 67.3% |
| Immigrants | Jordan | 92.8 /100 | #122 | Exceptional 67.3% |
| Immigrants | Northern Africa | 92.7 /100 | #123 | Exceptional 67.2% |
| Arabs | 92.6 /100 | #124 | Exceptional 67.2% |
| Italians | 91.8 /100 | #125 | Exceptional 67.2% |
| Alsatians | 91.3 /100 | #126 | Exceptional 67.1% |
| Czechs | 90.8 /100 | #127 | Exceptional 67.1% |
| Scottish | 90.2 /100 | #128 | Exceptional 67.0% |
| Immigrants | Eastern Africa | 89.5 /100 | #129 | Excellent 67.0% |
| Immigrants | Syria | 89.0 /100 | #130 | Excellent 66.9% |
Demographics Similar to Immigrants from Lithuania by College, Under 1 year
In terms of college, under 1 year, the demographic groups most similar to Immigrants from Lithuania are Immigrants from Kuwait (70.3%, a difference of 0.050%), Israeli (70.2%, a difference of 0.070%), New Zealander (70.2%, a difference of 0.070%), Immigrants from Turkey (70.3%, a difference of 0.090%), and Immigrants from Norway (70.2%, a difference of 0.090%).
| Demographics | Rating | Rank | College, Under 1 year |
| Russians | 99.9 /100 | #35 | Exceptional 70.5% |
| Immigrants | Sri Lanka | 99.9 /100 | #36 | Exceptional 70.5% |
| Immigrants | Saudi Arabia | 99.9 /100 | #37 | Exceptional 70.4% |
| Australians | 99.9 /100 | #38 | Exceptional 70.4% |
| Bhutanese | 99.9 /100 | #39 | Exceptional 70.3% |
| Immigrants | Turkey | 99.9 /100 | #40 | Exceptional 70.3% |
| Immigrants | Kuwait | 99.9 /100 | #41 | Exceptional 70.3% |
| Immigrants | Lithuania | 99.9 /100 | #42 | Exceptional 70.3% |
| Israelis | 99.9 /100 | #43 | Exceptional 70.2% |
| New Zealanders | 99.9 /100 | #44 | Exceptional 70.2% |
| Immigrants | Norway | 99.9 /100 | #45 | Exceptional 70.2% |
| Immigrants | Latvia | 99.9 /100 | #46 | Exceptional 70.1% |
| Immigrants | Bulgaria | 99.8 /100 | #47 | Exceptional 70.0% |
| Immigrants | Netherlands | 99.8 /100 | #48 | Exceptional 70.0% |
| Immigrants | Austria | 99.8 /100 | #49 | Exceptional 70.0% |