Immigrants from Cambodia vs Arapaho College, Under 1 year
COMPARE
Immigrants from Cambodia
Arapaho
College, Under 1 year
College, Under 1 year Comparison
Immigrants from Cambodia
Arapaho
61.5%
COLLEGE, UNDER 1 YEAR
0.4/ 100
METRIC RATING
254th/ 347
METRIC RANK
60.3%
COLLEGE, UNDER 1 YEAR
0.1/ 100
METRIC RATING
276th/ 347
METRIC RANK
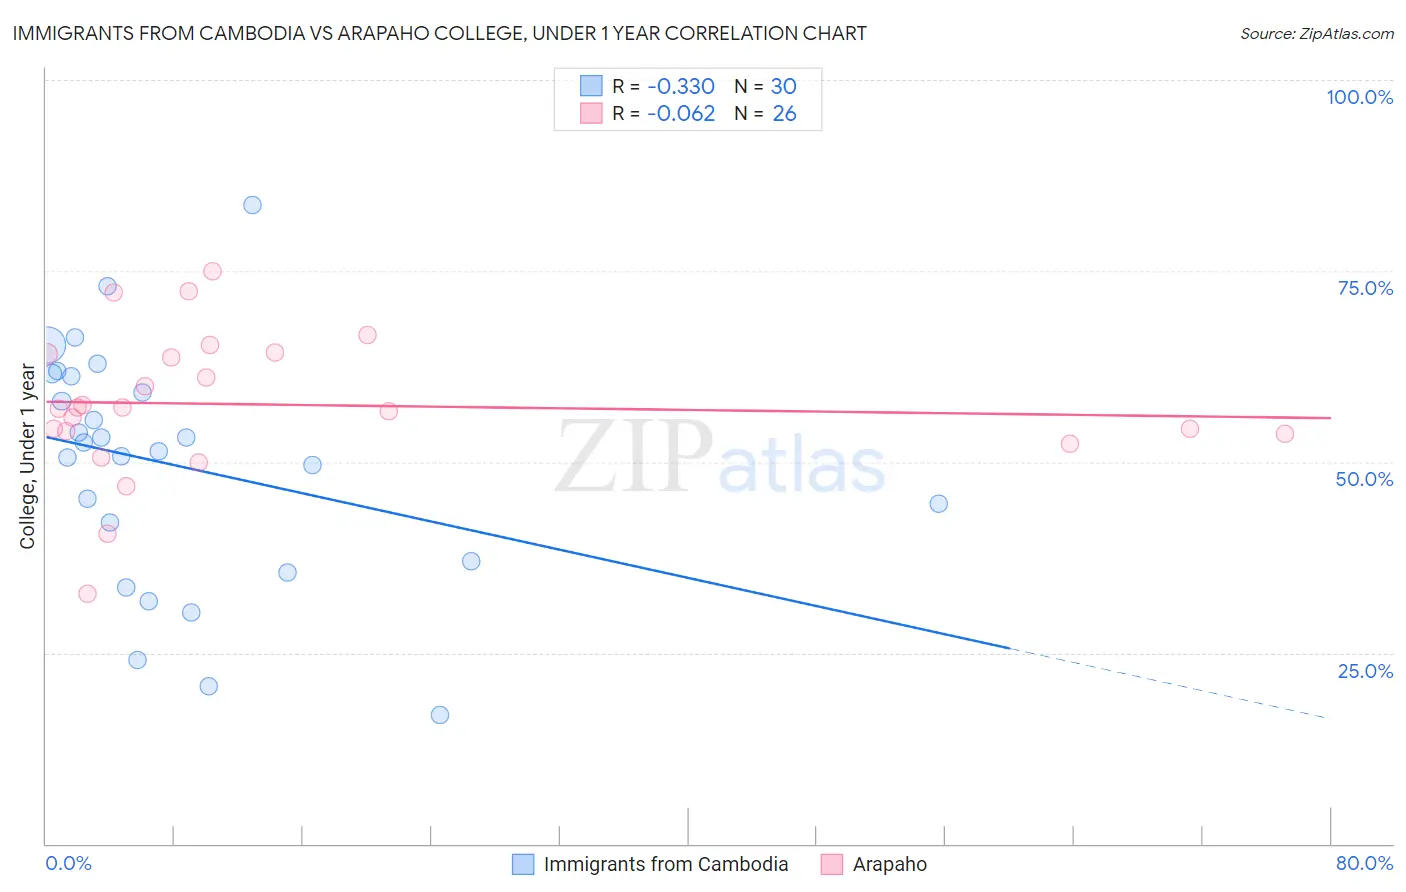
Immigrants from Cambodia vs Arapaho College, Under 1 year Correlation Chart
The statistical analysis conducted on geographies consisting of 205,153,442 people shows a mild negative correlation between the proportion of Immigrants from Cambodia and percentage of population with at least college, under 1 year education in the United States with a correlation coefficient (R) of -0.330 and weighted average of 61.5%. Similarly, the statistical analysis conducted on geographies consisting of 29,780,040 people shows a slight negative correlation between the proportion of Arapaho and percentage of population with at least college, under 1 year education in the United States with a correlation coefficient (R) of -0.062 and weighted average of 60.3%, a difference of 1.9%.
College, Under 1 year Correlation Summary
| Measurement | Immigrants from Cambodia | Arapaho |
| Minimum | 16.8% | 32.8% |
| Maximum | 83.7% | 75.0% |
| Range | 66.8% | 42.2% |
| Mean | 49.5% | 57.5% |
| Median | 52.0% | 57.1% |
| Interquartile 25% (IQ1) | 36.9% | 53.7% |
| Interquartile 75% (IQ3) | 61.3% | 64.1% |
| Interquartile Range (IQR) | 24.4% | 10.4% |
| Standard Deviation (Sample) | 15.6% | 9.4% |
| Standard Deviation (Population) | 15.3% | 9.3% |
Similar Demographics by College, Under 1 year
Demographics Similar to Immigrants from Cambodia by College, Under 1 year
In terms of college, under 1 year, the demographic groups most similar to Immigrants from Cambodia are West Indian (61.5%, a difference of 0.0%), Japanese (61.5%, a difference of 0.0%), Immigrants from Micronesia (61.5%, a difference of 0.11%), Comanche (61.4%, a difference of 0.12%), and Bangladeshi (61.4%, a difference of 0.17%).
| Demographics | Rating | Rank | College, Under 1 year |
| Immigrants | Liberia | 0.8 /100 | #247 | Tragic 61.9% |
| Potawatomi | 0.6 /100 | #248 | Tragic 61.8% |
| Vietnamese | 0.5 /100 | #249 | Tragic 61.7% |
| Immigrants | Congo | 0.5 /100 | #250 | Tragic 61.7% |
| Immigrants | Micronesia | 0.5 /100 | #251 | Tragic 61.5% |
| West Indians | 0.4 /100 | #252 | Tragic 61.5% |
| Japanese | 0.4 /100 | #253 | Tragic 61.5% |
| Immigrants | Cambodia | 0.4 /100 | #254 | Tragic 61.5% |
| Comanche | 0.4 /100 | #255 | Tragic 61.4% |
| Bangladeshis | 0.4 /100 | #256 | Tragic 61.4% |
| Immigrants | Laos | 0.3 /100 | #257 | Tragic 61.3% |
| Immigrants | Bangladesh | 0.3 /100 | #258 | Tragic 61.3% |
| Indonesians | 0.3 /100 | #259 | Tragic 61.2% |
| Blackfeet | 0.3 /100 | #260 | Tragic 61.1% |
| Africans | 0.3 /100 | #261 | Tragic 61.1% |
Demographics Similar to Arapaho by College, Under 1 year
In terms of college, under 1 year, the demographic groups most similar to Arapaho are Immigrants from Barbados (60.4%, a difference of 0.030%), Bahamian (60.3%, a difference of 0.14%), Chickasaw (60.4%, a difference of 0.16%), Alaska Native (60.4%, a difference of 0.16%), and Yaqui (60.2%, a difference of 0.17%).
| Demographics | Rating | Rank | College, Under 1 year |
| Immigrants | West Indies | 0.1 /100 | #269 | Tragic 60.6% |
| Cheyenne | 0.1 /100 | #270 | Tragic 60.6% |
| U.S. Virgin Islanders | 0.1 /100 | #271 | Tragic 60.6% |
| Jamaicans | 0.1 /100 | #272 | Tragic 60.5% |
| Chickasaw | 0.1 /100 | #273 | Tragic 60.4% |
| Alaska Natives | 0.1 /100 | #274 | Tragic 60.4% |
| Immigrants | Barbados | 0.1 /100 | #275 | Tragic 60.4% |
| Arapaho | 0.1 /100 | #276 | Tragic 60.3% |
| Bahamians | 0.1 /100 | #277 | Tragic 60.3% |
| Yaqui | 0.1 /100 | #278 | Tragic 60.2% |
| Ute | 0.1 /100 | #279 | Tragic 60.2% |
| Crow | 0.1 /100 | #280 | Tragic 60.2% |
| Cherokee | 0.1 /100 | #281 | Tragic 60.1% |
| Belizeans | 0.1 /100 | #282 | Tragic 60.1% |
| Immigrants | Jamaica | 0.0 /100 | #283 | Tragic 59.7% |