Immigrants from Northern Africa vs Apache College, Under 1 year

COMPARE

Immigrants from Northern Africa
Race
Ancestry
AfghanAfricanAlaska NativeAlaskan AthabascanAlbanianAleutAlsatianAmericanArabArapahoArgentineanArmenianAssyrian/Chaldean/SyriacAustralianAustrianBahamianBangladeshiBarbadianBasqueBelgianBelizeanBermudanBhutaneseBlackfeetBolivianBrazilianBritishBritish West IndianBulgarianBurmeseCajunCambodianCanadianCape VerdeanCarpatho RusynCelticCentral AmericanCentral American IndianCherokeeCheyenneChickasawChileanChineseChippewaChoctawColombianColvilleComancheCosta RicanCreeCreekCroatianCrowCubanCypriotCzechCzechoslovakianDanishDelawareDominicanDutchDutch West IndianEastern EuropeanEcuadorianEgyptianEnglishEstonianEthiopianEuropeanFijianFilipinoFinnishFrenchFrench American IndianFrench CanadianGermanGerman RussianGhanaianGreekGuamanian/ChamorroGuatemalanGuyaneseHaitianHmongHonduranHopiHoumaHungarianIcelanderIndian (Asian)IndonesianInupiatIranianIraqiIrishIroquoisIsraeliItalianJamaicanJapaneseJordanianKenyanKiowaKoreanLaotianLatvianLebaneseLiberianLithuanianLumbeeLuxembourgerMacedonianMalaysianMalteseMarshalleseMenomineeMexicanMexican American IndianMongolianMoroccanNative HawaiianNavajoNepaleseNew ZealanderNicaraguanNigerianNorthern EuropeanNorwegianOkinawanOsageOttawaPaiutePakistaniPalestinianPanamanianParaguayanPennsylvania GermanPeruvianPimaPolishPortuguesePotawatomiPuebloPuerto RicanPuget Sound SalishRomanianRussianSalvadoranSamoanScandinavianScotch-IrishScottishSeminoleSenegaleseSerbianShoshoneSierra LeoneanSiouxSlavicSlovakSloveneSomaliSouth AfricanSouth AmericanSouth American IndianSoviet UnionSpaniardSpanishSpanish AmericanSpanish American IndianSri LankanSubsaharan AfricanSudaneseSwedishSwissSyrianTaiwaneseThaiTlingit-HaidaTohono O'OdhamTonganTrinidadian and TobagonianTsimshianTurkishU.S. Virgin IslanderUgandanUkrainianUruguayanUteVenezuelanVietnameseWelshWest IndianYakamaYaquiYugoslavianYumanYup'ikZimbabwean
Immigration
NonimmigrantsImmigrantsAfghanistanAfricaAlbaniaArgentinaArmeniaAsiaAustraliaAustriaBahamasBangladeshBarbadosBelarusBelgiumBelizeBoliviaBosnia and HerzegovinaBrazilBulgariaBurma/MyanmarCabo VerdeCambodiaCameroonCanadaCaribbeanCentral AmericaChileChinaColombiaCongoCosta RicaCroatiaCubaCzechoslovakiaDenmarkDominicaDominican RepublicEastern AfricaEastern AsiaEastern EuropeEcuadorEgyptEl SalvadorEnglandEritreaEthiopiaEuropeFijiFranceGermanyGhanaGreeceGrenadaGuatemalaGuyanaHaitiHondurasHong KongHungaryIndiaIndonesiaIranIraqIrelandIsraelItalyJamaicaJapanJordanKazakhstanKenyaKoreaKuwaitLaosLatin AmericaLatviaLebanonLiberiaLithuaniaMalaysiaMexicoMicronesiaMiddle AfricaMoldovaMoroccoNepalNetherlandsNicaraguaNigeriaNorth AmericaNorth MacedoniaNorthern AfricaNorthern EuropeNorwayOceaniaPakistanPanamaPeruPhilippinesPolandPortugalRomaniaRussiaSaudi ArabiaScotlandSenegalSerbiaSierra LeoneSingaporeSomaliaSouth AfricaSouth AmericaSouth Central AsiaSouth Eastern AsiaSouthern EuropeSpainSri LankaSt. Vincent and the GrenadinesSudanSwedenSwitzerlandSyriaTaiwanThailandTrinidad and TobagoTurkeyUgandaUkraineUruguayUzbekistanVenezuelaVietnamWest IndiesWestern AfricaWestern AsiaWestern EuropeYemenZaireZimbabweAzores
Apache
Race
Ancestry
AfghanAfricanAlaska NativeAlaskan AthabascanAlbanianAleutAlsatianAmericanApacheArabArapahoArgentineanArmenianAssyrian/Chaldean/SyriacAustralianAustrianBahamianBangladeshiBarbadianBasqueBelgianBelizeanBermudanBhutaneseBlackfeetBolivianBrazilianBritishBritish West IndianBulgarianBurmeseCajunCambodianCanadianCape VerdeanCarpatho RusynCelticCentral AmericanCentral American IndianCherokeeCheyenneChickasawChileanChineseChippewaChoctawColombianColvilleComancheCosta RicanCreeCreekCroatianCrowCubanCypriotCzechCzechoslovakianDanishDelawareDominicanDutchDutch West IndianEastern EuropeanEcuadorianEgyptianEnglishEstonianEthiopianEuropeanFijianFilipinoFinnishFrenchFrench American IndianFrench CanadianGermanGerman RussianGhanaianGreekGuamanian/ChamorroGuatemalanGuyaneseHaitianHmongHonduranHopiHoumaHungarianIcelanderIndian (Asian)IndonesianInupiatIranianIraqiIrishIroquoisIsraeliItalianJamaicanJapaneseJordanianKenyanKiowaKoreanLaotianLatvianLebaneseLiberianLithuanianLumbeeLuxembourgerMacedonianMalaysianMalteseMarshalleseMenomineeMexicanMexican American IndianMongolianMoroccanNative HawaiianNavajoNepaleseNew ZealanderNicaraguanNigerianNorthern EuropeanNorwegianOkinawanOsageOttawaPaiutePakistaniPalestinianPanamanianParaguayanPennsylvania GermanPeruvianPimaPolishPortuguesePotawatomiPuebloPuerto RicanPuget Sound SalishRomanianRussianSalvadoranSamoanScandinavianScotch-IrishScottishSeminoleSenegaleseSerbianShoshoneSierra LeoneanSiouxSlavicSlovakSloveneSomaliSouth AfricanSouth AmericanSouth American IndianSoviet UnionSpaniardSpanishSpanish AmericanSpanish American IndianSri LankanSubsaharan AfricanSudaneseSwedishSwissSyrianTaiwaneseThaiTlingit-HaidaTohono O'OdhamTonganTrinidadian and TobagonianTsimshianTurkishU.S. Virgin IslanderUgandanUkrainianUruguayanUteVenezuelanVietnameseWelshWest IndianYakamaYaquiYugoslavianYumanYup'ikZimbabwean
Immigration
NonimmigrantsImmigrantsAfghanistanAfricaAlbaniaArgentinaArmeniaAsiaAustraliaAustriaBahamasBangladeshBarbadosBelarusBelgiumBelizeBoliviaBosnia and HerzegovinaBrazilBulgariaBurma/MyanmarCabo VerdeCambodiaCameroonCanadaCaribbeanCentral AmericaChileChinaColombiaCongoCosta RicaCroatiaCubaCzechoslovakiaDenmarkDominicaDominican RepublicEastern AfricaEastern AsiaEastern EuropeEcuadorEgyptEl SalvadorEnglandEritreaEthiopiaEuropeFijiFranceGermanyGhanaGreeceGrenadaGuatemalaGuyanaHaitiHondurasHong KongHungaryIndiaIndonesiaIranIraqIrelandIsraelItalyJamaicaJapanJordanKazakhstanKenyaKoreaKuwaitLaosLatin AmericaLatviaLebanonLiberiaLithuaniaMalaysiaMexicoMicronesiaMiddle AfricaMoldovaMoroccoNepalNetherlandsNicaraguaNigeriaNorth AmericaNorth MacedoniaNorthern EuropeNorwayOceaniaPakistanPanamaPeruPhilippinesPolandPortugalRomaniaRussiaSaudi ArabiaScotlandSenegalSerbiaSierra LeoneSingaporeSomaliaSouth AfricaSouth AmericaSouth Central AsiaSouth Eastern AsiaSouthern EuropeSpainSri LankaSt. Vincent and the GrenadinesSudanSwedenSwitzerlandSyriaTaiwanThailandTrinidad and TobagoTurkeyUgandaUkraineUruguayUzbekistanVenezuelaVietnamWest IndiesWestern AfricaWestern AsiaWestern EuropeYemenZaireZimbabweAzores
College, Under 1 year
Income
Poverty
Unemployment
Labor Participation
Family Structure
Vehicle Availability
Education Level
Disability

College, Under 1 year Comparison

Immigrants from Northern Africa

Apache

Exceptional
Tragic
67.2%
COLLEGE, UNDER 1 YEAR
92.7/ 100
METRIC RATING
123rd/ 347
METRIC RANK
58.0%
COLLEGE, UNDER 1 YEAR
0.0/ 100
METRIC RATING
302nd/ 347
METRIC RANK

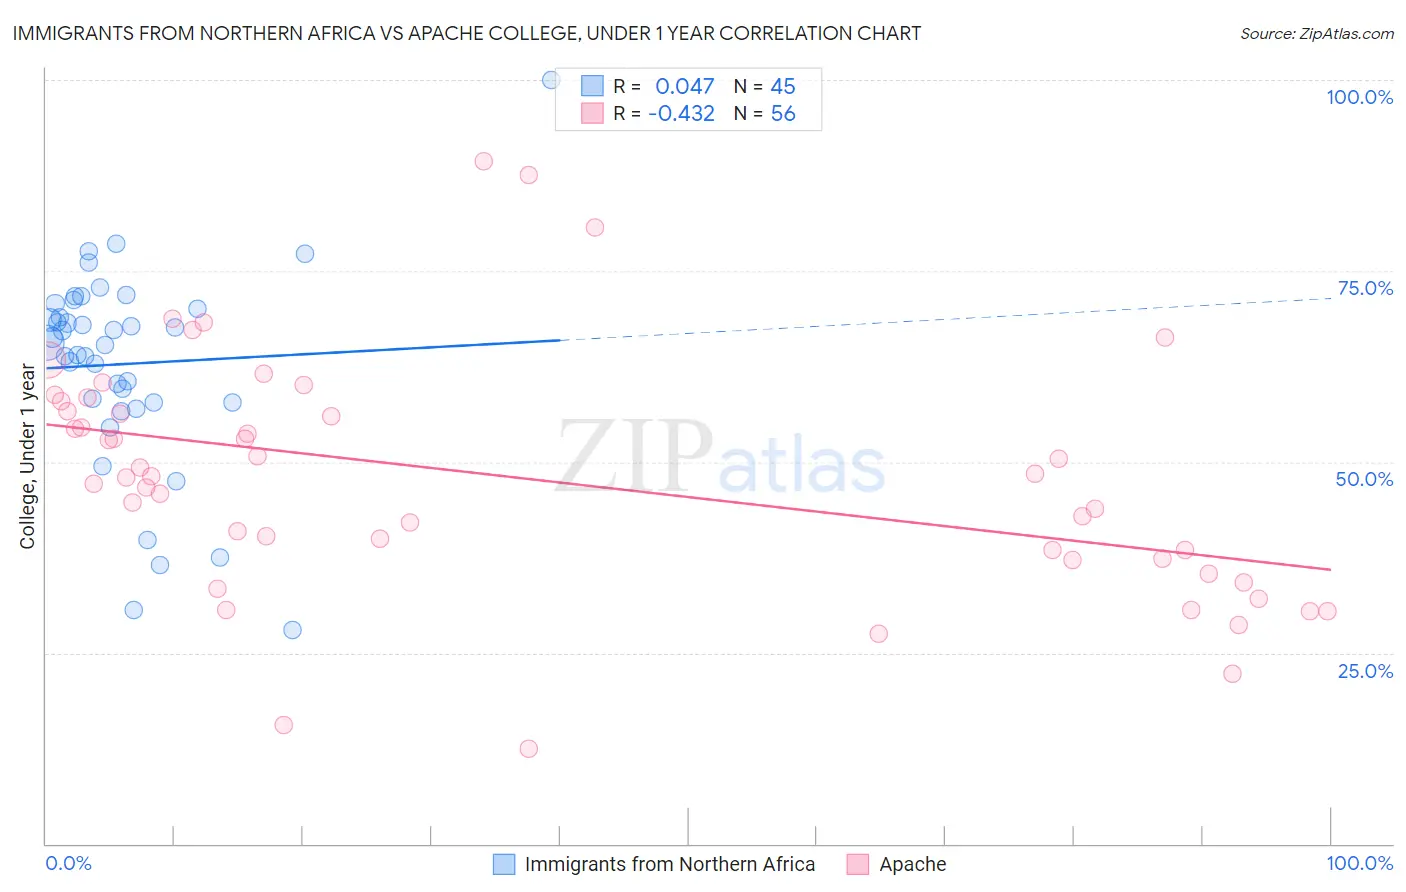
Immigrants from Northern Africa vs Apache College, Under 1 year Correlation Chart

The statistical analysis conducted on geographies consisting of 321,198,131 people shows no correlation between the proportion of Immigrants from Northern Africa and percentage of population with at least college, under 1 year education in the United States with a correlation coefficient (R) of 0.047 and weighted average of 67.2%. Similarly, the statistical analysis conducted on geographies consisting of 231,142,948 people shows a moderate negative correlation between the proportion of Apache and percentage of population with at least college, under 1 year education in the United States with a correlation coefficient (R) of -0.432 and weighted average of 58.0%, a difference of 15.9%.
Immigrants from Northern Africa vs Apache College, Under 1 year

College, Under 1 year Correlation Summary

MeasurementImmigrants from Northern AfricaApache
Minimum28.0%12.5%
Maximum100.0%89.3%
Range72.0%76.8%
Mean62.8%47.9%
Median65.6%48.0%
Interquartile 25% (IQ1)57.7%37.3%
Interquartile 75% (IQ3)70.4%57.3%
Interquartile Range (IQR)12.7%20.1%
Standard Deviation (Sample)13.3%15.9%
Standard Deviation (Population)13.2%15.7%

Similar Demographics by College, Under 1 year

Demographics Similar to Immigrants from Northern Africa by College, Under 1 year

In terms of college, under 1 year, the demographic groups most similar to Immigrants from Northern Africa are Arab (67.2%, a difference of 0.010%), Immigrants from Jordan (67.3%, a difference of 0.020%), Slovene (67.3%, a difference of 0.11%), Italian (67.2%, a difference of 0.13%), and Alsatian (67.1%, a difference of 0.19%).
DemographicsRating | RankCollege, Under 1 year
Immigrants | Nepal
94.9
/100
|
#116
Exceptional
67.5%
Pakistanis
94.8
/100
|
#117
Exceptional
67.5%
Immigrants | Ukraine
94.7
/100
|
#118
Exceptional
67.5%
Lebanese
94.6
/100
|
#119
Exceptional
67.5%
Serbians
93.9
/100
|
#120
Exceptional
67.4%
Slovenes
93.3
/100
|
#121
Exceptional
67.3%
Immigrants | Jordan
92.8
/100
|
#122
Exceptional
67.3%
Immigrants | Northern Africa
92.7
/100
|
#123
Exceptional
67.2%
Arabs
92.6
/100
|
#124
Exceptional
67.2%
Italians
91.8
/100
|
#125
Exceptional
67.2%
Alsatians
91.3
/100
|
#126
Exceptional
67.1%
Czechs
90.8
/100
|
#127
Exceptional
67.1%
Scottish
90.2
/100
|
#128
Exceptional
67.0%
Immigrants | Eastern Africa
89.5
/100
|
#129
Excellent
67.0%
Immigrants | Syria
89.0
/100
|
#130
Excellent
66.9%

Demographics Similar to Apache by College, Under 1 year

In terms of college, under 1 year, the demographic groups most similar to Apache are Mexican American Indian (58.1%, a difference of 0.19%), Immigrants from Dominica (57.9%, a difference of 0.29%), Kiowa (57.8%, a difference of 0.30%), Haitian (57.8%, a difference of 0.42%), and Immigrants from Portugal (57.7%, a difference of 0.62%).
DemographicsRating | RankCollege, Under 1 year
Immigrants | Grenada
0.0
/100
|
#295
Tragic
59.1%
Central American Indians
0.0
/100
|
#296
Tragic
59.0%
Guyanese
0.0
/100
|
#297
Tragic
59.0%
Immigrants | Ecuador
0.0
/100
|
#298
Tragic
58.7%
Cubans
0.0
/100
|
#299
Tragic
58.6%
Immigrants | Guyana
0.0
/100
|
#300
Tragic
58.5%
Mexican American Indians
0.0
/100
|
#301
Tragic
58.1%
Apache
0.0
/100
|
#302
Tragic
58.0%
Immigrants | Dominica
0.0
/100
|
#303
Tragic
57.9%
Kiowa
0.0
/100
|
#304
Tragic
57.8%
Haitians
0.0
/100
|
#305
Tragic
57.8%
Immigrants | Portugal
0.0
/100
|
#306
Tragic
57.7%
Fijians
0.0
/100
|
#307
Tragic
57.7%
Central Americans
0.0
/100
|
#308
Tragic
57.7%
Immigrants | Nicaragua
0.0
/100
|
#309
Tragic
57.6%