Immigrants from Northern Africa vs Carpatho Rusyn College, Under 1 year
COMPARE
Immigrants from Northern Africa
Carpatho Rusyn
College, Under 1 year
College, Under 1 year Comparison
Immigrants from Northern Africa
Carpatho Rusyns
67.2%
COLLEGE, UNDER 1 YEAR
92.7/ 100
METRIC RATING
123rd/ 347
METRIC RANK
67.9%
COLLEGE, UNDER 1 YEAR
96.8/ 100
METRIC RATING
103rd/ 347
METRIC RANK
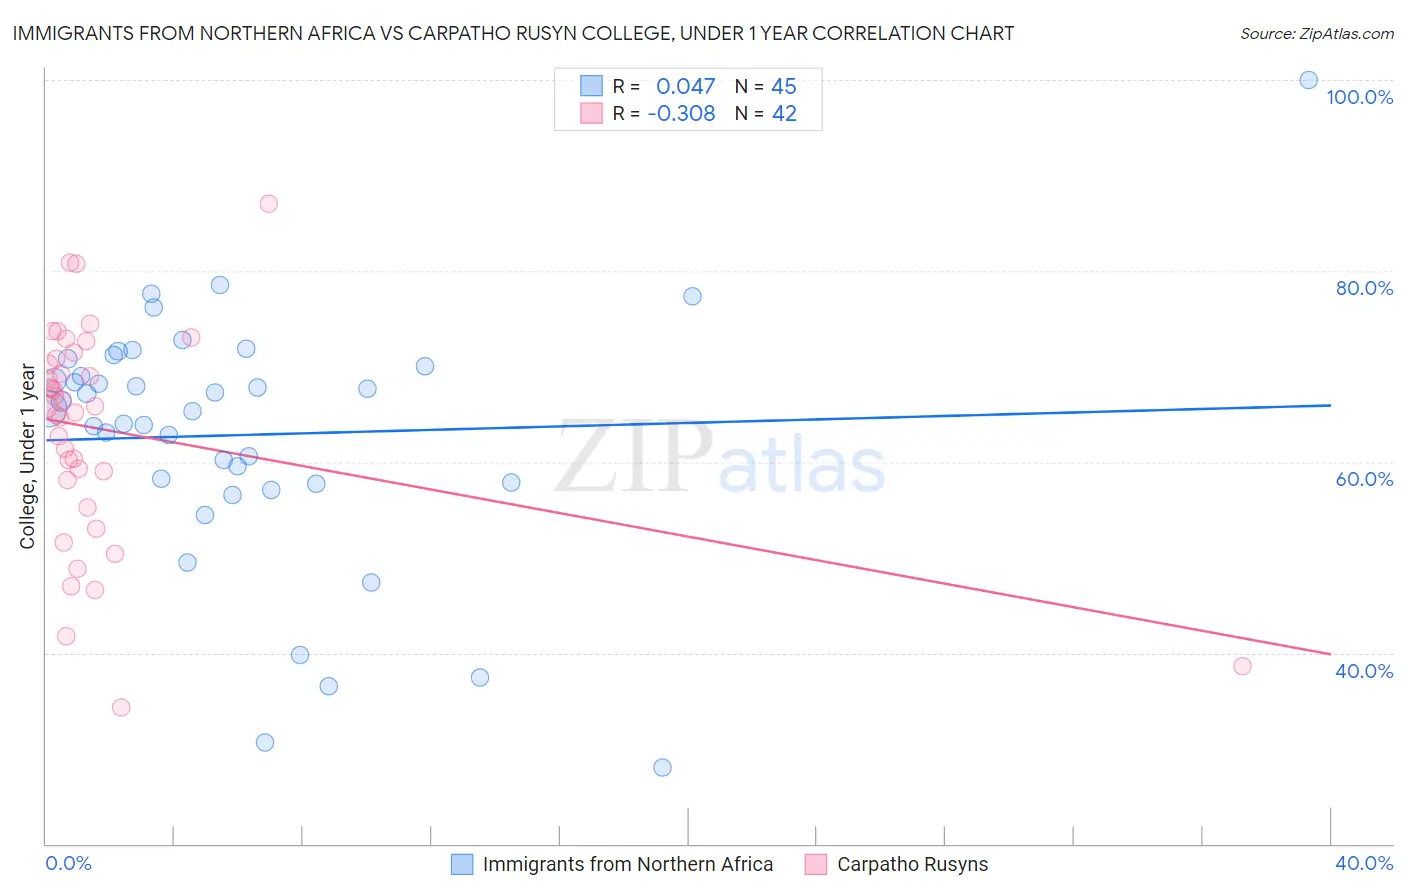
Immigrants from Northern Africa vs Carpatho Rusyn College, Under 1 year Correlation Chart
The statistical analysis conducted on geographies consisting of 321,198,131 people shows no correlation between the proportion of Immigrants from Northern Africa and percentage of population with at least college, under 1 year education in the United States with a correlation coefficient (R) of 0.047 and weighted average of 67.2%. Similarly, the statistical analysis conducted on geographies consisting of 58,871,690 people shows a mild negative correlation between the proportion of Carpatho Rusyns and percentage of population with at least college, under 1 year education in the United States with a correlation coefficient (R) of -0.308 and weighted average of 67.9%, a difference of 0.95%.
College, Under 1 year Correlation Summary
| Measurement | Immigrants from Northern Africa | Carpatho Rusyn |
| Minimum | 28.0% | 34.2% |
| Maximum | 100.0% | 87.0% |
| Range | 72.0% | 52.8% |
| Mean | 62.8% | 63.3% |
| Median | 65.6% | 65.8% |
| Interquartile 25% (IQ1) | 57.7% | 58.1% |
| Interquartile 75% (IQ3) | 70.4% | 70.8% |
| Interquartile Range (IQR) | 12.7% | 12.7% |
| Standard Deviation (Sample) | 13.3% | 11.5% |
| Standard Deviation (Population) | 13.2% | 11.3% |
Demographics Similar to Immigrants from Northern Africa and Carpatho Rusyns by College, Under 1 year
In terms of college, under 1 year, the demographic groups most similar to Immigrants from Northern Africa are Immigrants from Jordan (67.3%, a difference of 0.020%), Slovene (67.3%, a difference of 0.11%), Serbian (67.4%, a difference of 0.20%), Lebanese (67.5%, a difference of 0.35%), and Immigrants from Ukraine (67.5%, a difference of 0.36%). Similarly, the demographic groups most similar to Carpatho Rusyns are Immigrants from Western Asia (67.8%, a difference of 0.070%), Afghan (67.8%, a difference of 0.080%), Immigrants from Croatia (67.8%, a difference of 0.090%), Austrian (67.8%, a difference of 0.14%), and Immigrants from Egypt (67.7%, a difference of 0.26%).
| Demographics | Rating | Rank | College, Under 1 year |
| Carpatho Rusyns | 96.8 /100 | #103 | Exceptional 67.9% |
| Immigrants | Western Asia | 96.6 /100 | #104 | Exceptional 67.8% |
| Afghans | 96.6 /100 | #105 | Exceptional 67.8% |
| Immigrants | Croatia | 96.6 /100 | #106 | Exceptional 67.8% |
| Austrians | 96.4 /100 | #107 | Exceptional 67.8% |
| Immigrants | Egypt | 96.0 /100 | #108 | Exceptional 67.7% |
| Scandinavians | 95.8 /100 | #109 | Exceptional 67.7% |
| Assyrians/Chaldeans/Syriacs | 95.8 /100 | #110 | Exceptional 67.7% |
| Ukrainians | 95.8 /100 | #111 | Exceptional 67.7% |
| Macedonians | 95.7 /100 | #112 | Exceptional 67.6% |
| Syrians | 95.6 /100 | #113 | Exceptional 67.6% |
| Chileans | 95.3 /100 | #114 | Exceptional 67.6% |
| Basques | 95.2 /100 | #115 | Exceptional 67.6% |
| Immigrants | Nepal | 94.9 /100 | #116 | Exceptional 67.5% |
| Pakistanis | 94.8 /100 | #117 | Exceptional 67.5% |
| Immigrants | Ukraine | 94.7 /100 | #118 | Exceptional 67.5% |
| Lebanese | 94.6 /100 | #119 | Exceptional 67.5% |
| Serbians | 93.9 /100 | #120 | Exceptional 67.4% |
| Slovenes | 93.3 /100 | #121 | Exceptional 67.3% |
| Immigrants | Jordan | 92.8 /100 | #122 | Exceptional 67.3% |
| Immigrants | Northern Africa | 92.7 /100 | #123 | Exceptional 67.2% |