Immigrants from China vs Indonesian GED/Equivalency
COMPARE
Immigrants from China
Indonesian
GED/Equivalency
GED/Equivalency Comparison
Immigrants from China
Indonesians
86.9%
GED/EQUIVALENCY
93.2/ 100
METRIC RATING
119th/ 347
METRIC RANK
82.5%
GED/EQUIVALENCY
0.1/ 100
METRIC RATING
283rd/ 347
METRIC RANK
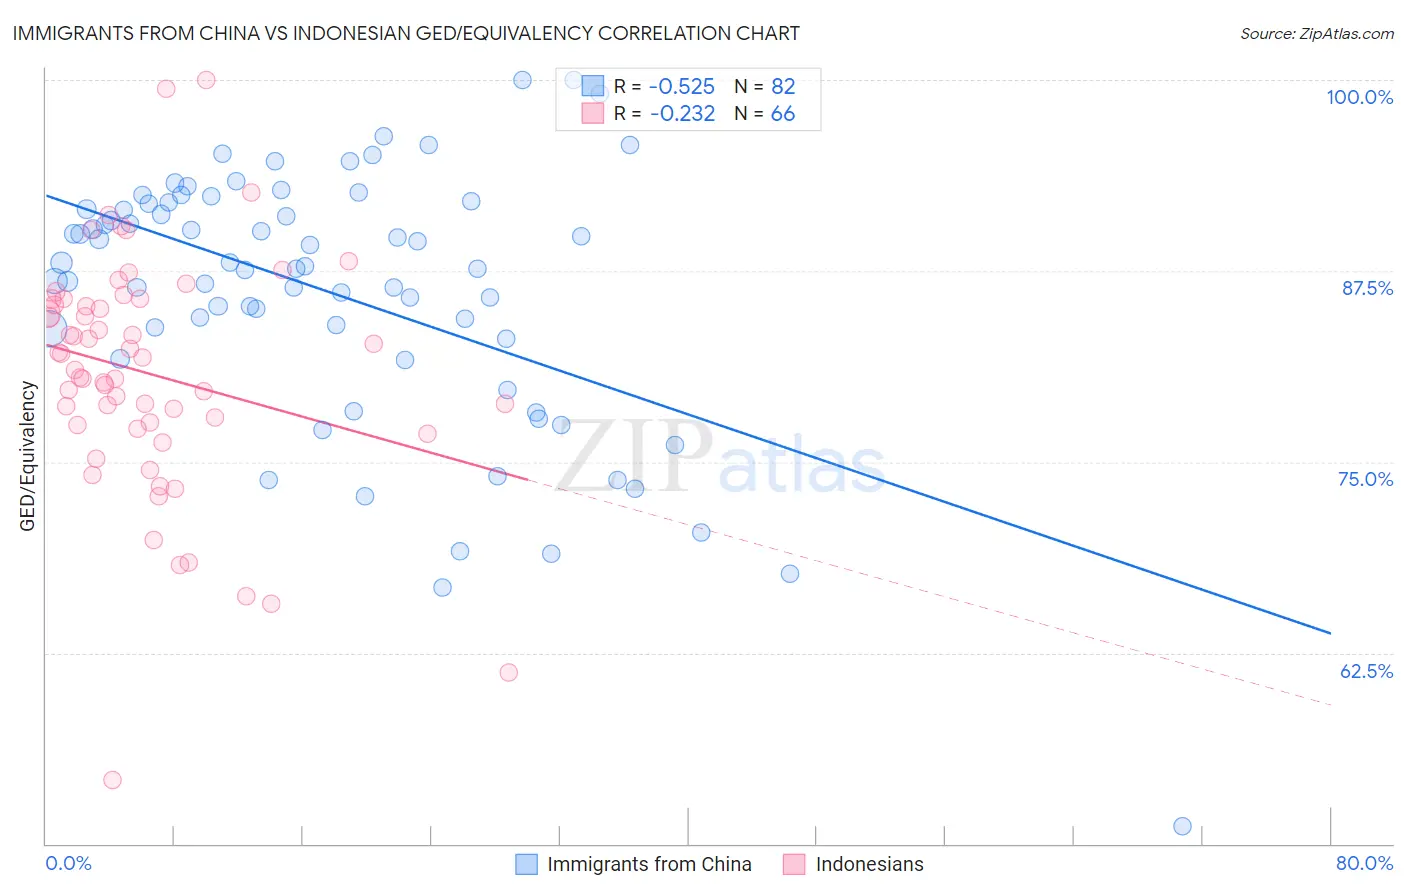
Immigrants from China vs Indonesian GED/Equivalency Correlation Chart
The statistical analysis conducted on geographies consisting of 457,082,738 people shows a substantial negative correlation between the proportion of Immigrants from China and percentage of population with at least ged/equivalency education in the United States with a correlation coefficient (R) of -0.525 and weighted average of 86.9%. Similarly, the statistical analysis conducted on geographies consisting of 162,727,113 people shows a weak negative correlation between the proportion of Indonesians and percentage of population with at least ged/equivalency education in the United States with a correlation coefficient (R) of -0.232 and weighted average of 82.5%, a difference of 5.3%.
GED/Equivalency Correlation Summary
| Measurement | Immigrants from China | Indonesian |
| Minimum | 51.2% | 54.2% |
| Maximum | 100.0% | 100.0% |
| Range | 48.8% | 45.8% |
| Mean | 86.0% | 80.8% |
| Median | 87.7% | 81.4% |
| Interquartile 25% (IQ1) | 83.1% | 77.4% |
| Interquartile 75% (IQ3) | 91.9% | 85.7% |
| Interquartile Range (IQR) | 8.8% | 8.2% |
| Standard Deviation (Sample) | 8.6% | 7.9% |
| Standard Deviation (Population) | 8.6% | 7.9% |
Similar Demographics by GED/Equivalency
Demographics Similar to Immigrants from China by GED/Equivalency
In terms of ged/equivalency, the demographic groups most similar to Immigrants from China are French Canadian (86.9%, a difference of 0.0%), Immigrants from Hong Kong (86.9%, a difference of 0.050%), Swiss (87.0%, a difference of 0.12%), Scotch-Irish (86.8%, a difference of 0.12%), and Immigrants from Kazakhstan (87.0%, a difference of 0.13%).
| Demographics | Rating | Rank | GED/Equivalency |
| Tlingit-Haida | 94.8 /100 | #112 | Exceptional 87.0% |
| Assyrians/Chaldeans/Syriacs | 94.8 /100 | #113 | Exceptional 87.0% |
| Immigrants | Kazakhstan | 94.7 /100 | #114 | Exceptional 87.0% |
| Mongolians | 94.6 /100 | #115 | Exceptional 87.0% |
| Swiss | 94.5 /100 | #116 | Exceptional 87.0% |
| Immigrants | Hong Kong | 93.8 /100 | #117 | Exceptional 86.9% |
| French Canadians | 93.2 /100 | #118 | Exceptional 86.9% |
| Immigrants | China | 93.2 /100 | #119 | Exceptional 86.9% |
| Scotch-Irish | 91.6 /100 | #120 | Exceptional 86.8% |
| Immigrants | Lebanon | 90.9 /100 | #121 | Exceptional 86.8% |
| Immigrants | Jordan | 90.8 /100 | #122 | Exceptional 86.8% |
| Immigrants | Italy | 90.5 /100 | #123 | Exceptional 86.7% |
| Immigrants | Egypt | 90.4 /100 | #124 | Exceptional 86.7% |
| Celtics | 90.4 /100 | #125 | Exceptional 86.7% |
| Asians | 90.3 /100 | #126 | Exceptional 86.7% |
Demographics Similar to Indonesians by GED/Equivalency
In terms of ged/equivalency, the demographic groups most similar to Indonesians are Immigrants (82.6%, a difference of 0.050%), Immigrants from Barbados (82.4%, a difference of 0.12%), Sioux (82.6%, a difference of 0.14%), Cajun (82.4%, a difference of 0.15%), and Immigrants from West Indies (82.4%, a difference of 0.18%).
| Demographics | Rating | Rank | GED/Equivalency |
| Blacks/African Americans | 0.1 /100 | #276 | Tragic 82.8% |
| Arapaho | 0.1 /100 | #277 | Tragic 82.8% |
| Immigrants | Laos | 0.1 /100 | #278 | Tragic 82.7% |
| Immigrants | Fiji | 0.1 /100 | #279 | Tragic 82.7% |
| Cheyenne | 0.1 /100 | #280 | Tragic 82.7% |
| Sioux | 0.1 /100 | #281 | Tragic 82.6% |
| Immigrants | Immigrants | 0.1 /100 | #282 | Tragic 82.6% |
| Indonesians | 0.1 /100 | #283 | Tragic 82.5% |
| Immigrants | Barbados | 0.1 /100 | #284 | Tragic 82.4% |
| Cajuns | 0.0 /100 | #285 | Tragic 82.4% |
| Immigrants | West Indies | 0.0 /100 | #286 | Tragic 82.4% |
| Japanese | 0.0 /100 | #287 | Tragic 82.4% |
| Pueblo | 0.0 /100 | #288 | Tragic 82.3% |
| Immigrants | Cambodia | 0.0 /100 | #289 | Tragic 82.2% |
| Haitians | 0.0 /100 | #290 | Tragic 82.1% |