Immigrants from Nepal vs Indonesian Single Father Households
COMPARE
Immigrants from Nepal
Indonesian
Single Father Households
Single Father Households Comparison
Immigrants from Nepal
Indonesians
2.2%
SINGLE FATHER HOUSEHOLDS
92.1/ 100
METRIC RATING
143rd/ 347
METRIC RANK
2.6%
SINGLE FATHER HOUSEHOLDS
0.5/ 100
METRIC RATING
264th/ 347
METRIC RANK
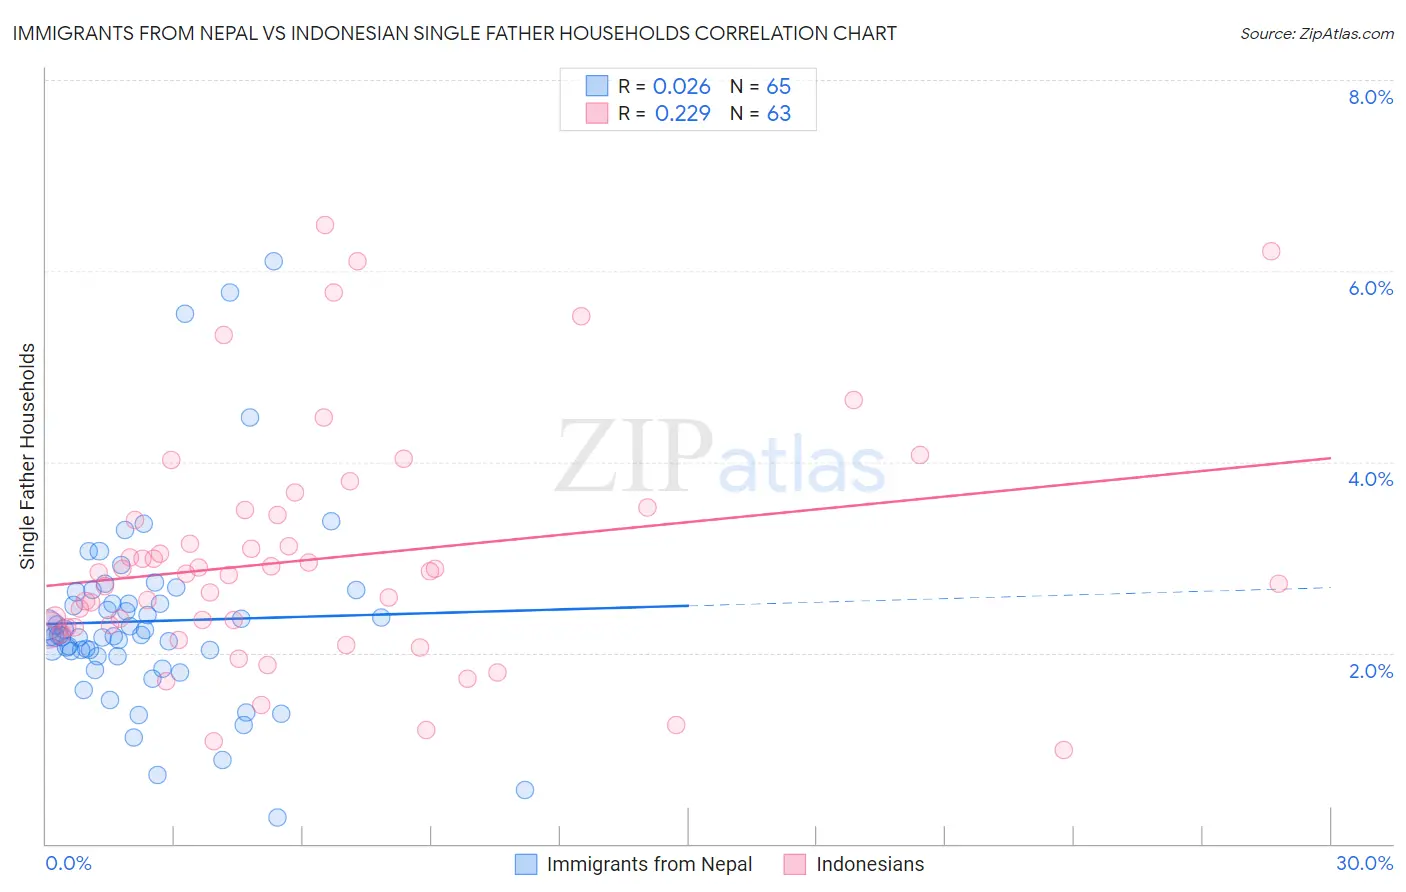
Immigrants from Nepal vs Indonesian Single Father Households Correlation Chart
The statistical analysis conducted on geographies consisting of 186,164,733 people shows no correlation between the proportion of Immigrants from Nepal and percentage of single father households in the United States with a correlation coefficient (R) of 0.026 and weighted average of 2.2%. Similarly, the statistical analysis conducted on geographies consisting of 162,222,781 people shows a weak positive correlation between the proportion of Indonesians and percentage of single father households in the United States with a correlation coefficient (R) of 0.229 and weighted average of 2.6%, a difference of 14.9%.
Single Father Households Correlation Summary
| Measurement | Immigrants from Nepal | Indonesian |
| Minimum | 0.28% | 0.98% |
| Maximum | 6.1% | 6.5% |
| Range | 5.8% | 5.5% |
| Mean | 2.3% | 3.0% |
| Median | 2.2% | 2.8% |
| Interquartile 25% (IQ1) | 2.0% | 2.3% |
| Interquartile 75% (IQ3) | 2.6% | 3.4% |
| Interquartile Range (IQR) | 0.61% | 1.2% |
| Standard Deviation (Sample) | 1.0% | 1.2% |
| Standard Deviation (Population) | 1.0% | 1.2% |
Similar Demographics by Single Father Households
Demographics Similar to Immigrants from Nepal by Single Father Households
In terms of single father households, the demographic groups most similar to Immigrants from Nepal are Luxembourger (2.2%, a difference of 0.060%), Laotian (2.2%, a difference of 0.10%), Brazilian (2.2%, a difference of 0.19%), British (2.2%, a difference of 0.19%), and Slovak (2.2%, a difference of 0.34%).
| Demographics | Rating | Rank | Single Father Households |
| Chileans | 94.5 /100 | #136 | Exceptional 2.2% |
| Austrians | 94.2 /100 | #137 | Exceptional 2.2% |
| West Indians | 94.1 /100 | #138 | Exceptional 2.2% |
| Brazilians | 92.8 /100 | #139 | Exceptional 2.2% |
| British | 92.8 /100 | #140 | Exceptional 2.2% |
| Laotians | 92.5 /100 | #141 | Exceptional 2.2% |
| Luxembourgers | 92.3 /100 | #142 | Exceptional 2.2% |
| Immigrants | Nepal | 92.1 /100 | #143 | Exceptional 2.2% |
| Slovaks | 90.7 /100 | #144 | Exceptional 2.2% |
| Immigrants | Zimbabwe | 90.2 /100 | #145 | Exceptional 2.2% |
| Northern Europeans | 89.8 /100 | #146 | Excellent 2.2% |
| Slavs | 88.9 /100 | #147 | Excellent 2.2% |
| South American Indians | 88.5 /100 | #148 | Excellent 2.3% |
| Senegalese | 88.4 /100 | #149 | Excellent 2.3% |
| Venezuelans | 86.2 /100 | #150 | Excellent 2.3% |
Demographics Similar to Indonesians by Single Father Households
In terms of single father households, the demographic groups most similar to Indonesians are Immigrants from Micronesia (2.6%, a difference of 0.060%), French American Indian (2.6%, a difference of 0.10%), Guamanian/Chamorro (2.6%, a difference of 0.57%), Haitian (2.6%, a difference of 0.61%), and Dominican (2.5%, a difference of 0.69%).
| Demographics | Rating | Rank | Single Father Households |
| Immigrants | Congo | 1.2 /100 | #257 | Tragic 2.5% |
| Spanish | 1.1 /100 | #258 | Tragic 2.5% |
| Comanche | 1.0 /100 | #259 | Tragic 2.5% |
| Immigrants | Caribbean | 1.0 /100 | #260 | Tragic 2.5% |
| Immigrants | Belize | 0.9 /100 | #261 | Tragic 2.5% |
| Immigrants | Liberia | 0.8 /100 | #262 | Tragic 2.5% |
| Dominicans | 0.8 /100 | #263 | Tragic 2.5% |
| Indonesians | 0.5 /100 | #264 | Tragic 2.6% |
| Immigrants | Micronesia | 0.5 /100 | #265 | Tragic 2.6% |
| French American Indians | 0.5 /100 | #266 | Tragic 2.6% |
| Guamanians/Chamorros | 0.4 /100 | #267 | Tragic 2.6% |
| Haitians | 0.4 /100 | #268 | Tragic 2.6% |
| Cubans | 0.3 /100 | #269 | Tragic 2.6% |
| Seminole | 0.3 /100 | #270 | Tragic 2.6% |
| Creek | 0.2 /100 | #271 | Tragic 2.6% |