Immigrants from the Azores vs Indonesian GED/Equivalency
COMPARE
Immigrants from the Azores
Indonesian
GED/Equivalency
GED/Equivalency Comparison
Immigrants from the Azores
Indonesians
78.7%
GED/EQUIVALENCY
0.0/ 100
METRIC RATING
332nd/ 347
METRIC RANK
82.5%
GED/EQUIVALENCY
0.1/ 100
METRIC RATING
283rd/ 347
METRIC RANK
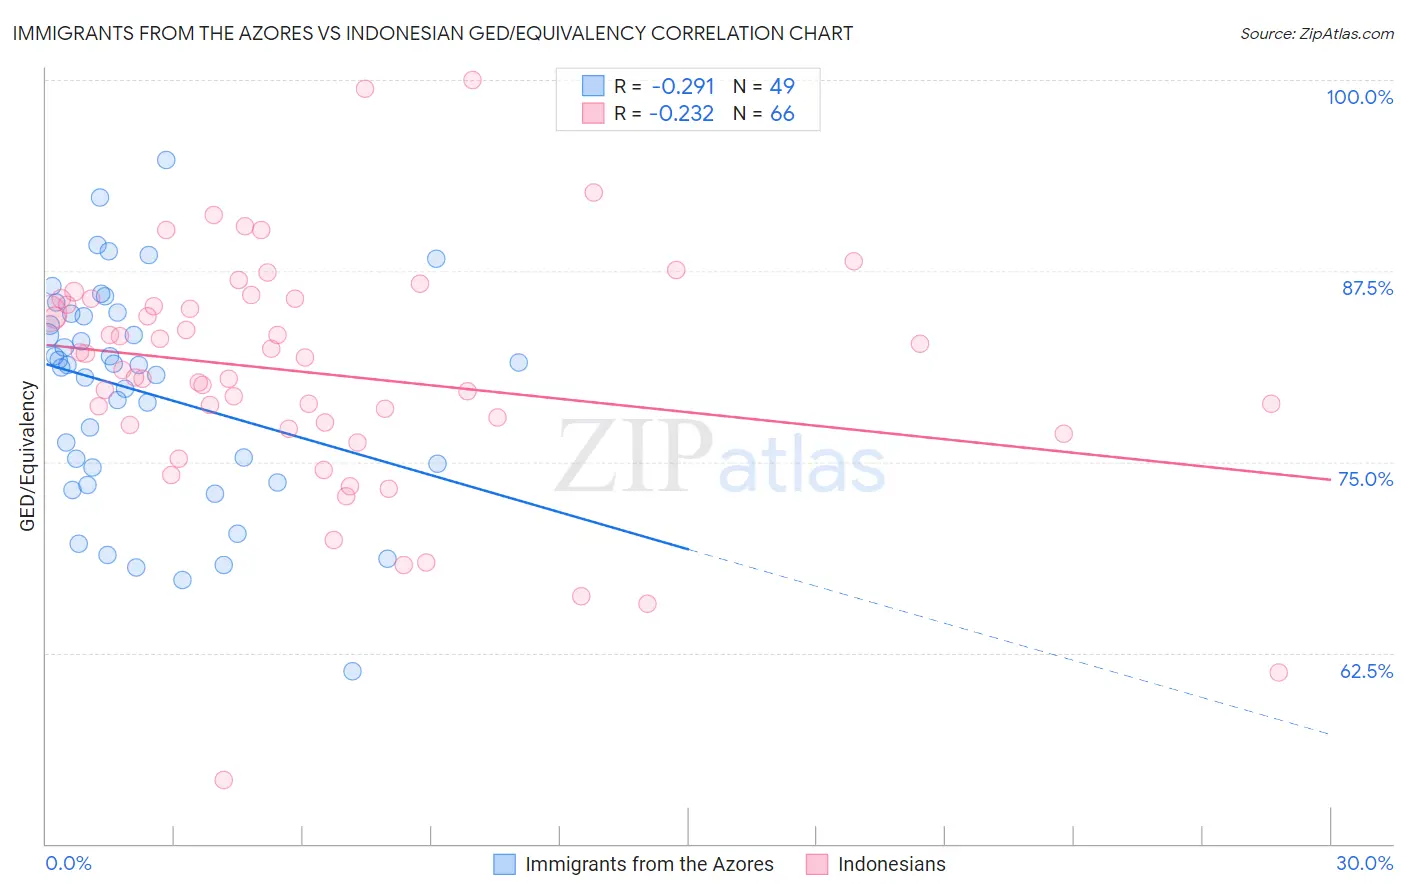
Immigrants from the Azores vs Indonesian GED/Equivalency Correlation Chart
The statistical analysis conducted on geographies consisting of 46,257,310 people shows a weak negative correlation between the proportion of Immigrants from the Azores and percentage of population with at least ged/equivalency education in the United States with a correlation coefficient (R) of -0.291 and weighted average of 78.7%. Similarly, the statistical analysis conducted on geographies consisting of 162,727,113 people shows a weak negative correlation between the proportion of Indonesians and percentage of population with at least ged/equivalency education in the United States with a correlation coefficient (R) of -0.232 and weighted average of 82.5%, a difference of 4.9%.
GED/Equivalency Correlation Summary
| Measurement | Immigrants from the Azores | Indonesian |
| Minimum | 61.3% | 54.2% |
| Maximum | 94.8% | 100.0% |
| Range | 33.5% | 45.8% |
| Mean | 79.5% | 80.8% |
| Median | 81.3% | 81.4% |
| Interquartile 25% (IQ1) | 74.2% | 77.4% |
| Interquartile 75% (IQ3) | 84.6% | 85.7% |
| Interquartile Range (IQR) | 10.5% | 8.2% |
| Standard Deviation (Sample) | 7.2% | 7.9% |
| Standard Deviation (Population) | 7.1% | 7.9% |
Similar Demographics by GED/Equivalency
Demographics Similar to Immigrants from the Azores by GED/Equivalency
In terms of ged/equivalency, the demographic groups most similar to Immigrants from the Azores are Immigrants from Honduras (78.7%, a difference of 0.11%), Salvadoran (78.6%, a difference of 0.11%), Guatemalan (78.5%, a difference of 0.20%), Immigrants from Latin America (78.5%, a difference of 0.22%), and Immigrants from Cabo Verde (78.9%, a difference of 0.36%).
| Demographics | Rating | Rank | GED/Equivalency |
| Hondurans | 0.0 /100 | #325 | Tragic 79.3% |
| Yuman | 0.0 /100 | #326 | Tragic 79.2% |
| Central Americans | 0.0 /100 | #327 | Tragic 79.2% |
| Hispanics or Latinos | 0.0 /100 | #328 | Tragic 79.1% |
| Dominicans | 0.0 /100 | #329 | Tragic 79.1% |
| Immigrants | Cabo Verde | 0.0 /100 | #330 | Tragic 78.9% |
| Immigrants | Honduras | 0.0 /100 | #331 | Tragic 78.7% |
| Immigrants | Azores | 0.0 /100 | #332 | Tragic 78.7% |
| Salvadorans | 0.0 /100 | #333 | Tragic 78.6% |
| Guatemalans | 0.0 /100 | #334 | Tragic 78.5% |
| Immigrants | Latin America | 0.0 /100 | #335 | Tragic 78.5% |
| Immigrants | Dominican Republic | 0.0 /100 | #336 | Tragic 78.0% |
| Immigrants | Yemen | 0.0 /100 | #337 | Tragic 77.9% |
| Immigrants | Guatemala | 0.0 /100 | #338 | Tragic 77.9% |
| Immigrants | El Salvador | 0.0 /100 | #339 | Tragic 77.6% |
Demographics Similar to Indonesians by GED/Equivalency
In terms of ged/equivalency, the demographic groups most similar to Indonesians are Immigrants (82.6%, a difference of 0.050%), Immigrants from Barbados (82.4%, a difference of 0.12%), Sioux (82.6%, a difference of 0.14%), Cajun (82.4%, a difference of 0.15%), and Immigrants from West Indies (82.4%, a difference of 0.18%).
| Demographics | Rating | Rank | GED/Equivalency |
| Blacks/African Americans | 0.1 /100 | #276 | Tragic 82.8% |
| Arapaho | 0.1 /100 | #277 | Tragic 82.8% |
| Immigrants | Laos | 0.1 /100 | #278 | Tragic 82.7% |
| Immigrants | Fiji | 0.1 /100 | #279 | Tragic 82.7% |
| Cheyenne | 0.1 /100 | #280 | Tragic 82.7% |
| Sioux | 0.1 /100 | #281 | Tragic 82.6% |
| Immigrants | Immigrants | 0.1 /100 | #282 | Tragic 82.6% |
| Indonesians | 0.1 /100 | #283 | Tragic 82.5% |
| Immigrants | Barbados | 0.1 /100 | #284 | Tragic 82.4% |
| Cajuns | 0.0 /100 | #285 | Tragic 82.4% |
| Immigrants | West Indies | 0.0 /100 | #286 | Tragic 82.4% |
| Japanese | 0.0 /100 | #287 | Tragic 82.4% |
| Pueblo | 0.0 /100 | #288 | Tragic 82.3% |
| Immigrants | Cambodia | 0.0 /100 | #289 | Tragic 82.2% |
| Haitians | 0.0 /100 | #290 | Tragic 82.1% |