Slavic vs Indonesian GED/Equivalency
COMPARE
Slavic
Indonesian
GED/Equivalency
GED/Equivalency Comparison
Slavs
Indonesians
87.7%
GED/EQUIVALENCY
98.7/ 100
METRIC RATING
77th/ 347
METRIC RANK
82.5%
GED/EQUIVALENCY
0.1/ 100
METRIC RATING
283rd/ 347
METRIC RANK
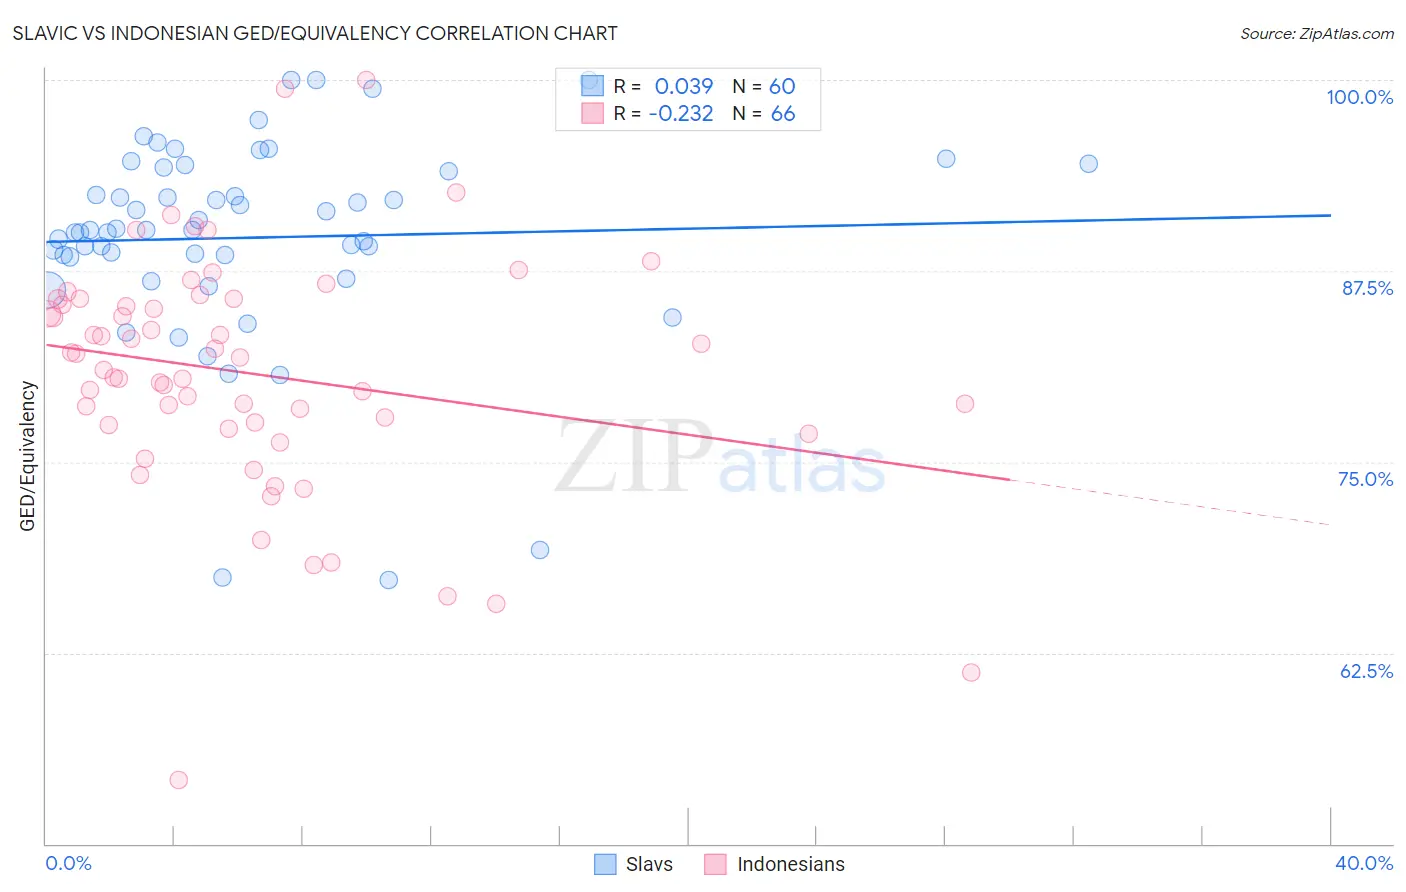
Slavic vs Indonesian GED/Equivalency Correlation Chart
The statistical analysis conducted on geographies consisting of 270,868,774 people shows no correlation between the proportion of Slavs and percentage of population with at least ged/equivalency education in the United States with a correlation coefficient (R) of 0.039 and weighted average of 87.7%. Similarly, the statistical analysis conducted on geographies consisting of 162,727,113 people shows a weak negative correlation between the proportion of Indonesians and percentage of population with at least ged/equivalency education in the United States with a correlation coefficient (R) of -0.232 and weighted average of 82.5%, a difference of 6.2%.
GED/Equivalency Correlation Summary
| Measurement | Slavic | Indonesian |
| Minimum | 67.2% | 54.2% |
| Maximum | 100.0% | 100.0% |
| Range | 32.8% | 45.8% |
| Mean | 89.7% | 80.8% |
| Median | 90.2% | 81.4% |
| Interquartile 25% (IQ1) | 88.5% | 77.4% |
| Interquartile 75% (IQ3) | 94.2% | 85.7% |
| Interquartile Range (IQR) | 5.7% | 8.2% |
| Standard Deviation (Sample) | 6.7% | 7.9% |
| Standard Deviation (Population) | 6.7% | 7.9% |
Similar Demographics by GED/Equivalency
Demographics Similar to Slavs by GED/Equivalency
In terms of ged/equivalency, the demographic groups most similar to Slavs are Immigrants from Serbia (87.7%, a difference of 0.010%), Scottish (87.7%, a difference of 0.020%), Irish (87.6%, a difference of 0.020%), Immigrants from Kuwait (87.7%, a difference of 0.040%), and Belgian (87.7%, a difference of 0.050%).
| Demographics | Rating | Rank | GED/Equivalency |
| Ukrainians | 98.8 /100 | #70 | Exceptional 87.7% |
| Austrians | 98.8 /100 | #71 | Exceptional 87.7% |
| Immigrants | Moldova | 98.8 /100 | #72 | Exceptional 87.7% |
| Belgians | 98.8 /100 | #73 | Exceptional 87.7% |
| Immigrants | Kuwait | 98.8 /100 | #74 | Exceptional 87.7% |
| Scottish | 98.7 /100 | #75 | Exceptional 87.7% |
| Immigrants | Serbia | 98.7 /100 | #76 | Exceptional 87.7% |
| Slavs | 98.7 /100 | #77 | Exceptional 87.7% |
| Irish | 98.6 /100 | #78 | Exceptional 87.6% |
| English | 98.6 /100 | #79 | Exceptional 87.6% |
| Immigrants | England | 98.5 /100 | #80 | Exceptional 87.6% |
| Immigrants | Sri Lanka | 98.3 /100 | #81 | Exceptional 87.5% |
| Romanians | 98.3 /100 | #82 | Exceptional 87.5% |
| South Africans | 98.3 /100 | #83 | Exceptional 87.5% |
| Immigrants | Romania | 98.1 /100 | #84 | Exceptional 87.5% |
Demographics Similar to Indonesians by GED/Equivalency
In terms of ged/equivalency, the demographic groups most similar to Indonesians are Immigrants (82.6%, a difference of 0.050%), Immigrants from Barbados (82.4%, a difference of 0.12%), Sioux (82.6%, a difference of 0.14%), Cajun (82.4%, a difference of 0.15%), and Immigrants from West Indies (82.4%, a difference of 0.18%).
| Demographics | Rating | Rank | GED/Equivalency |
| Blacks/African Americans | 0.1 /100 | #276 | Tragic 82.8% |
| Arapaho | 0.1 /100 | #277 | Tragic 82.8% |
| Immigrants | Laos | 0.1 /100 | #278 | Tragic 82.7% |
| Immigrants | Fiji | 0.1 /100 | #279 | Tragic 82.7% |
| Cheyenne | 0.1 /100 | #280 | Tragic 82.7% |
| Sioux | 0.1 /100 | #281 | Tragic 82.6% |
| Immigrants | Immigrants | 0.1 /100 | #282 | Tragic 82.6% |
| Indonesians | 0.1 /100 | #283 | Tragic 82.5% |
| Immigrants | Barbados | 0.1 /100 | #284 | Tragic 82.4% |
| Cajuns | 0.0 /100 | #285 | Tragic 82.4% |
| Immigrants | West Indies | 0.0 /100 | #286 | Tragic 82.4% |
| Japanese | 0.0 /100 | #287 | Tragic 82.4% |
| Pueblo | 0.0 /100 | #288 | Tragic 82.3% |
| Immigrants | Cambodia | 0.0 /100 | #289 | Tragic 82.2% |
| Haitians | 0.0 /100 | #290 | Tragic 82.1% |