Pima vs Immigrants from Ukraine GED/Equivalency
COMPARE
Pima
Immigrants from Ukraine
GED/Equivalency
GED/Equivalency Comparison
Pima
Immigrants from Ukraine
76.4%
GED/EQUIVALENCY
0.0/ 100
METRIC RATING
342nd/ 347
METRIC RANK
86.7%
GED/EQUIVALENCY
88.9/ 100
METRIC RATING
129th/ 347
METRIC RANK
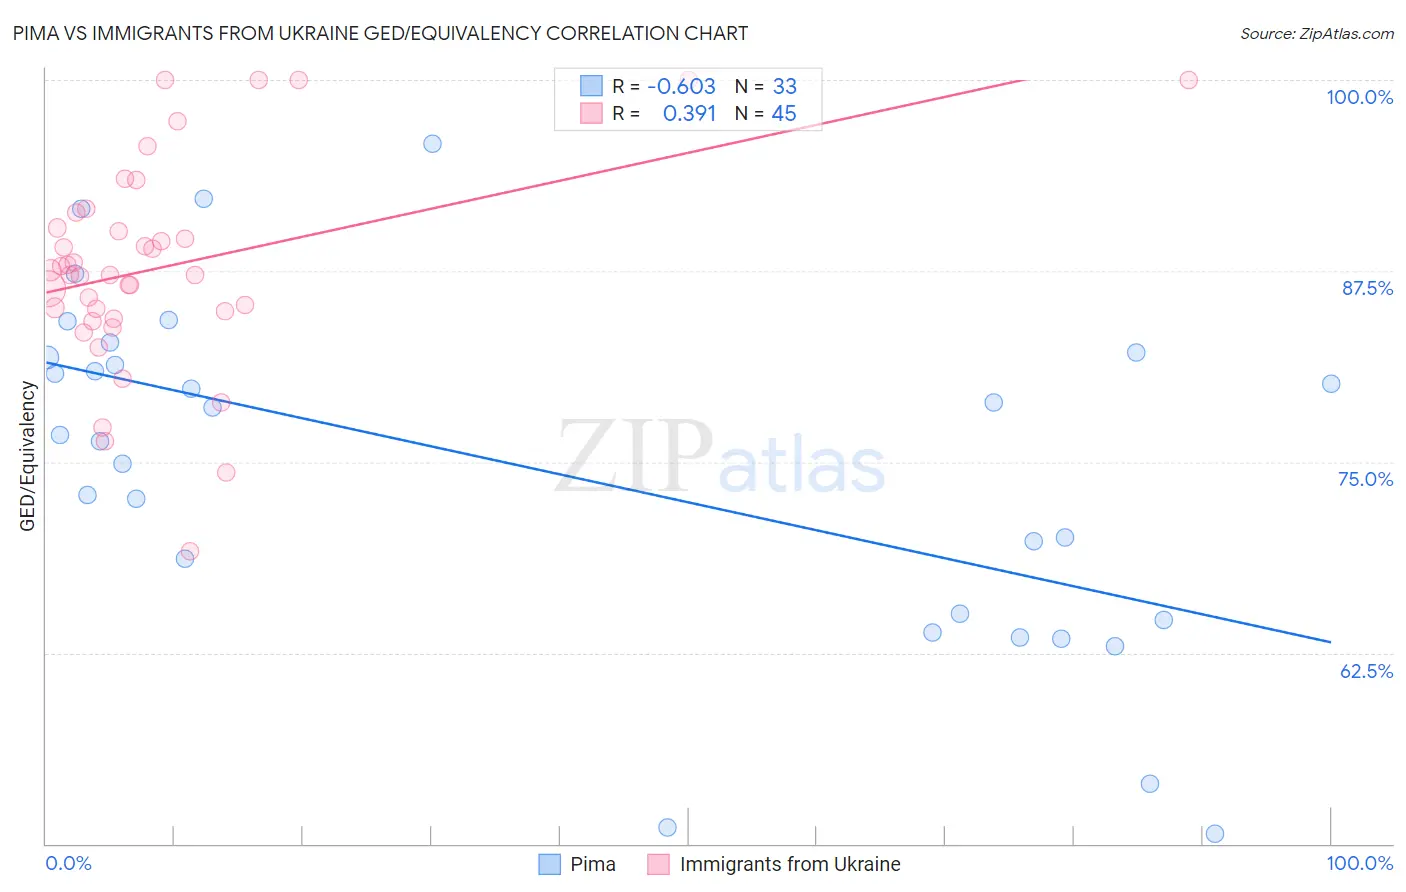
Pima vs Immigrants from Ukraine GED/Equivalency Correlation Chart
The statistical analysis conducted on geographies consisting of 61,552,828 people shows a significant negative correlation between the proportion of Pima and percentage of population with at least ged/equivalency education in the United States with a correlation coefficient (R) of -0.603 and weighted average of 76.4%. Similarly, the statistical analysis conducted on geographies consisting of 289,714,613 people shows a mild positive correlation between the proportion of Immigrants from Ukraine and percentage of population with at least ged/equivalency education in the United States with a correlation coefficient (R) of 0.391 and weighted average of 86.7%, a difference of 13.4%.
GED/Equivalency Correlation Summary
| Measurement | Pima | Immigrants from Ukraine |
| Minimum | 50.7% | 69.1% |
| Maximum | 95.8% | 100.0% |
| Range | 45.2% | 30.9% |
| Mean | 74.7% | 87.8% |
| Median | 76.8% | 87.3% |
| Interquartile 25% (IQ1) | 64.8% | 84.6% |
| Interquartile 75% (IQ3) | 82.0% | 90.8% |
| Interquartile Range (IQR) | 17.2% | 6.2% |
| Standard Deviation (Sample) | 11.4% | 6.8% |
| Standard Deviation (Population) | 11.2% | 6.7% |
Similar Demographics by GED/Equivalency
Demographics Similar to Pima by GED/Equivalency
In terms of ged/equivalency, the demographic groups most similar to Pima are Immigrants from Central America (76.4%, a difference of 0.090%), Spanish American Indian (76.3%, a difference of 0.12%), Immigrants from Mexico (75.7%, a difference of 1.0%), Mexican (77.4%, a difference of 1.3%), and Tohono O'odham (77.5%, a difference of 1.4%).
| Demographics | Rating | Rank | GED/Equivalency |
| Salvadorans | 0.0 /100 | #333 | Tragic 78.6% |
| Guatemalans | 0.0 /100 | #334 | Tragic 78.5% |
| Immigrants | Latin America | 0.0 /100 | #335 | Tragic 78.5% |
| Immigrants | Dominican Republic | 0.0 /100 | #336 | Tragic 78.0% |
| Immigrants | Yemen | 0.0 /100 | #337 | Tragic 77.9% |
| Immigrants | Guatemala | 0.0 /100 | #338 | Tragic 77.9% |
| Immigrants | El Salvador | 0.0 /100 | #339 | Tragic 77.6% |
| Tohono O'odham | 0.0 /100 | #340 | Tragic 77.5% |
| Mexicans | 0.0 /100 | #341 | Tragic 77.4% |
| Pima | 0.0 /100 | #342 | Tragic 76.4% |
| Immigrants | Central America | 0.0 /100 | #343 | Tragic 76.4% |
| Spanish American Indians | 0.0 /100 | #344 | Tragic 76.3% |
| Immigrants | Mexico | 0.0 /100 | #345 | Tragic 75.7% |
| Houma | 0.0 /100 | #346 | Tragic 75.0% |
| Yakama | 0.0 /100 | #347 | Tragic 74.5% |
Demographics Similar to Immigrants from Ukraine by GED/Equivalency
In terms of ged/equivalency, the demographic groups most similar to Immigrants from Ukraine are Immigrants from Germany (86.7%, a difference of 0.0%), Immigrants from Spain (86.7%, a difference of 0.020%), Yugoslavian (86.7%, a difference of 0.030%), Immigrants from Brazil (86.6%, a difference of 0.030%), and Tsimshian (86.6%, a difference of 0.030%).
| Demographics | Rating | Rank | GED/Equivalency |
| Immigrants | Jordan | 90.8 /100 | #122 | Exceptional 86.8% |
| Immigrants | Italy | 90.5 /100 | #123 | Exceptional 86.7% |
| Immigrants | Egypt | 90.4 /100 | #124 | Exceptional 86.7% |
| Celtics | 90.4 /100 | #125 | Exceptional 86.7% |
| Asians | 90.3 /100 | #126 | Exceptional 86.7% |
| Argentineans | 89.7 /100 | #127 | Excellent 86.7% |
| Yugoslavians | 89.5 /100 | #128 | Excellent 86.7% |
| Immigrants | Ukraine | 88.9 /100 | #129 | Excellent 86.7% |
| Immigrants | Germany | 88.8 /100 | #130 | Excellent 86.7% |
| Immigrants | Spain | 88.5 /100 | #131 | Excellent 86.7% |
| Immigrants | Brazil | 88.4 /100 | #132 | Excellent 86.6% |
| Tsimshian | 88.3 /100 | #133 | Excellent 86.6% |
| Albanians | 87.7 /100 | #134 | Excellent 86.6% |
| Immigrants | Asia | 87.4 /100 | #135 | Excellent 86.6% |
| Chileans | 86.9 /100 | #136 | Excellent 86.6% |