Icelander vs Pennsylvania German GED/Equivalency
COMPARE
Icelander
Pennsylvania German
GED/Equivalency
GED/Equivalency Comparison
Icelanders
Pennsylvania Germans
87.1%
GED/EQUIVALENCY
95.7/ 100
METRIC RATING
107th/ 347
METRIC RANK
82.9%
GED/EQUIVALENCY
0.1/ 100
METRIC RATING
273rd/ 347
METRIC RANK
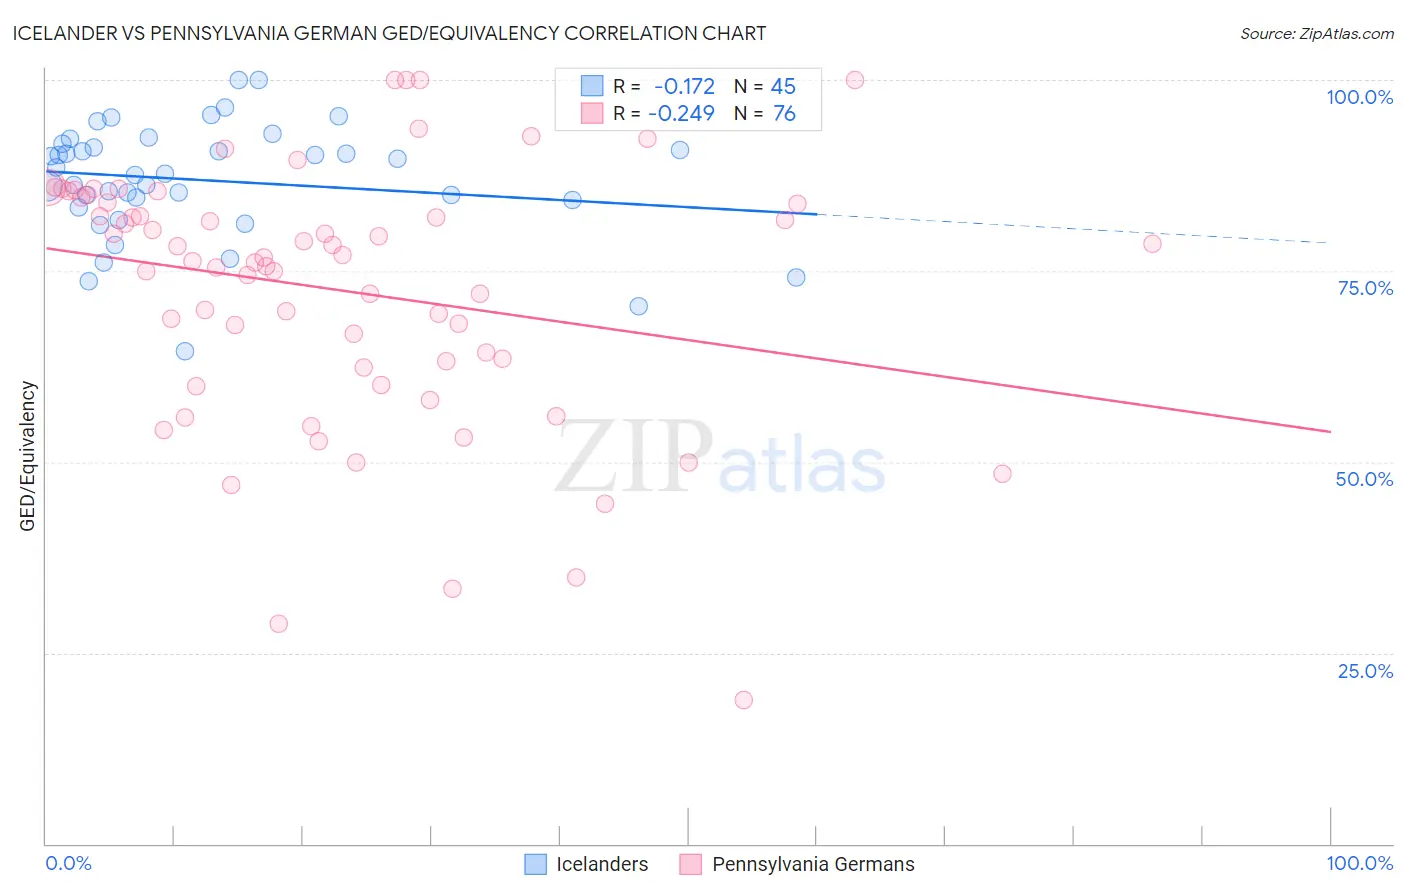
Icelander vs Pennsylvania German GED/Equivalency Correlation Chart
The statistical analysis conducted on geographies consisting of 159,668,816 people shows a poor negative correlation between the proportion of Icelanders and percentage of population with at least ged/equivalency education in the United States with a correlation coefficient (R) of -0.172 and weighted average of 87.1%. Similarly, the statistical analysis conducted on geographies consisting of 234,102,935 people shows a weak negative correlation between the proportion of Pennsylvania Germans and percentage of population with at least ged/equivalency education in the United States with a correlation coefficient (R) of -0.249 and weighted average of 82.9%, a difference of 5.2%.
GED/Equivalency Correlation Summary
| Measurement | Icelander | Pennsylvania German |
| Minimum | 64.5% | 18.8% |
| Maximum | 100.0% | 100.0% |
| Range | 35.5% | 81.2% |
| Mean | 86.9% | 72.5% |
| Median | 87.7% | 76.5% |
| Interquartile 25% (IQ1) | 83.8% | 62.8% |
| Interquartile 75% (IQ3) | 91.4% | 84.3% |
| Interquartile Range (IQR) | 7.6% | 21.5% |
| Standard Deviation (Sample) | 7.5% | 17.0% |
| Standard Deviation (Population) | 7.4% | 16.9% |
Similar Demographics by GED/Equivalency
Demographics Similar to Icelanders by GED/Equivalency
In terms of ged/equivalency, the demographic groups most similar to Icelanders are Immigrants from Zimbabwe (87.1%, a difference of 0.010%), Indian (Asian) (87.1%, a difference of 0.020%), Canadian (87.1%, a difference of 0.020%), Immigrants from Hungary (87.2%, a difference of 0.030%), and Immigrants from Eastern Europe (87.1%, a difference of 0.030%).
| Demographics | Rating | Rank | GED/Equivalency |
| Palestinians | 96.8 /100 | #100 | Exceptional 87.3% |
| Syrians | 96.6 /100 | #101 | Exceptional 87.2% |
| Lebanese | 96.2 /100 | #102 | Exceptional 87.2% |
| Jordanians | 96.1 /100 | #103 | Exceptional 87.2% |
| Immigrants | Hungary | 96.0 /100 | #104 | Exceptional 87.2% |
| Indians (Asian) | 95.9 /100 | #105 | Exceptional 87.1% |
| Immigrants | Zimbabwe | 95.8 /100 | #106 | Exceptional 87.1% |
| Icelanders | 95.7 /100 | #107 | Exceptional 87.1% |
| Canadians | 95.6 /100 | #108 | Exceptional 87.1% |
| Immigrants | Eastern Europe | 95.5 /100 | #109 | Exceptional 87.1% |
| Egyptians | 95.3 /100 | #110 | Exceptional 87.1% |
| French | 95.2 /100 | #111 | Exceptional 87.1% |
| Tlingit-Haida | 94.8 /100 | #112 | Exceptional 87.0% |
| Assyrians/Chaldeans/Syriacs | 94.8 /100 | #113 | Exceptional 87.0% |
| Immigrants | Kazakhstan | 94.7 /100 | #114 | Exceptional 87.0% |
Demographics Similar to Pennsylvania Germans by GED/Equivalency
In terms of ged/equivalency, the demographic groups most similar to Pennsylvania Germans are Barbadian (82.9%, a difference of 0.010%), Immigrants from Trinidad and Tobago (82.8%, a difference of 0.020%), U.S. Virgin Islander (82.9%, a difference of 0.050%), Seminole (82.8%, a difference of 0.080%), and Immigrants from Jamaica (82.9%, a difference of 0.090%).
| Demographics | Rating | Rank | GED/Equivalency |
| Kiowa | 0.2 /100 | #266 | Tragic 83.1% |
| Trinidadians and Tobagonians | 0.2 /100 | #267 | Tragic 83.0% |
| Immigrants | Burma/Myanmar | 0.2 /100 | #268 | Tragic 83.0% |
| Hopi | 0.2 /100 | #269 | Tragic 83.0% |
| Immigrants | Jamaica | 0.2 /100 | #270 | Tragic 82.9% |
| U.S. Virgin Islanders | 0.2 /100 | #271 | Tragic 82.9% |
| Barbadians | 0.1 /100 | #272 | Tragic 82.9% |
| Pennsylvania Germans | 0.1 /100 | #273 | Tragic 82.9% |
| Immigrants | Trinidad and Tobago | 0.1 /100 | #274 | Tragic 82.8% |
| Seminole | 0.1 /100 | #275 | Tragic 82.8% |
| Blacks/African Americans | 0.1 /100 | #276 | Tragic 82.8% |
| Arapaho | 0.1 /100 | #277 | Tragic 82.8% |
| Immigrants | Laos | 0.1 /100 | #278 | Tragic 82.7% |
| Immigrants | Fiji | 0.1 /100 | #279 | Tragic 82.7% |
| Cheyenne | 0.1 /100 | #280 | Tragic 82.7% |