Immigrants from Malaysia vs Pennsylvania German Householder Income Ages 25 - 44 years
COMPARE
Immigrants from Malaysia
Pennsylvania German
Householder Income Ages 25 - 44 years
Householder Income Ages 25 - 44 years Comparison
Immigrants from Malaysia
Pennsylvania Germans
$107,650
HOUSEHOLDER INCOME AGES 25 - 44 YEARS
99.9/ 100
METRIC RATING
43rd/ 347
METRIC RANK
$85,836
HOUSEHOLDER INCOME AGES 25 - 44 YEARS
0.8/ 100
METRIC RATING
250th/ 347
METRIC RANK
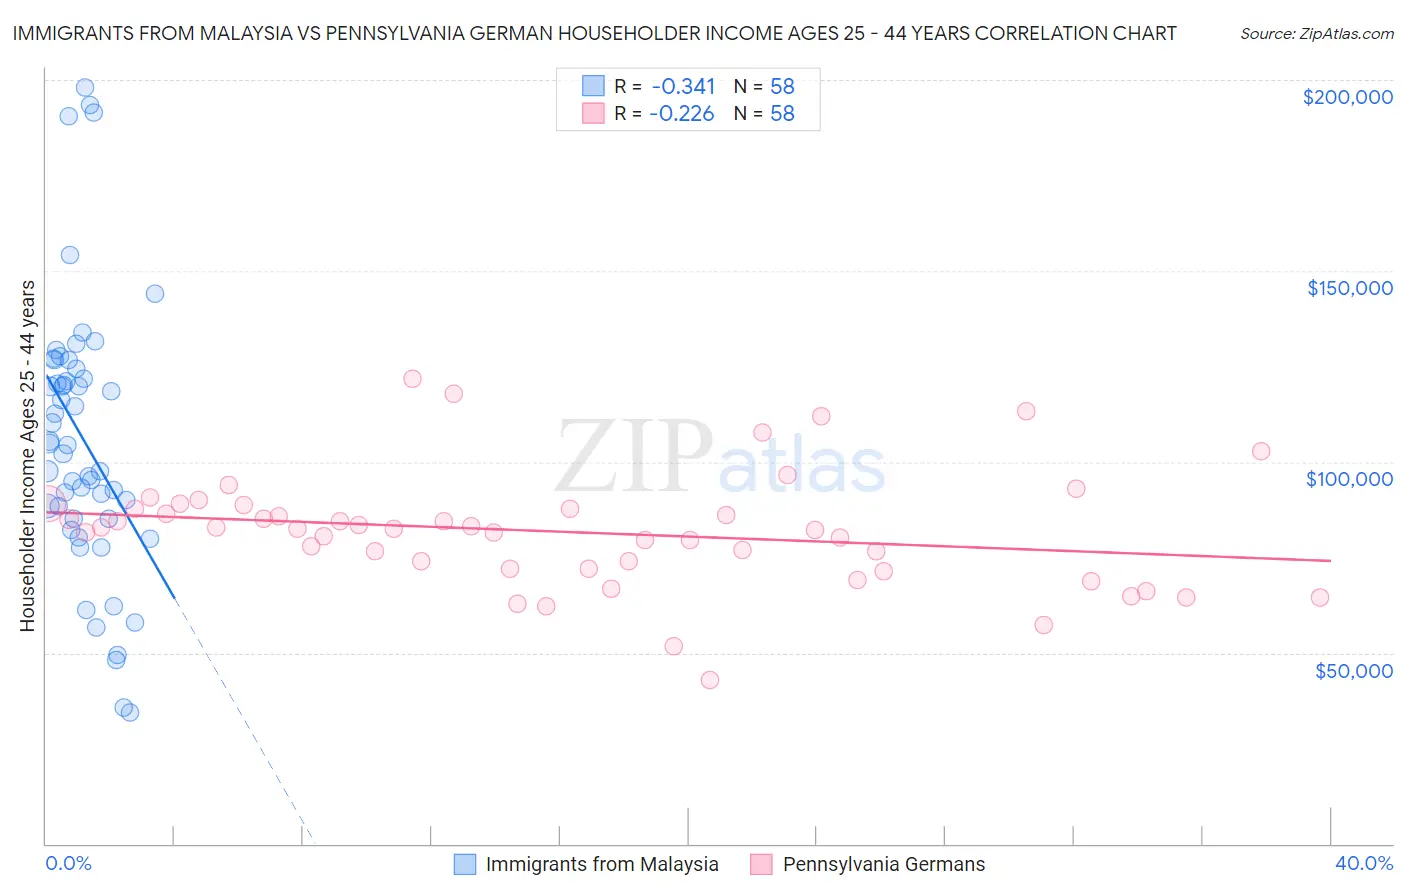
Immigrants from Malaysia vs Pennsylvania German Householder Income Ages 25 - 44 years Correlation Chart
The statistical analysis conducted on geographies consisting of 197,845,248 people shows a mild negative correlation between the proportion of Immigrants from Malaysia and household income with householder between the ages 25 and 44 in the United States with a correlation coefficient (R) of -0.341 and weighted average of $107,650. Similarly, the statistical analysis conducted on geographies consisting of 233,340,356 people shows a weak negative correlation between the proportion of Pennsylvania Germans and household income with householder between the ages 25 and 44 in the United States with a correlation coefficient (R) of -0.226 and weighted average of $85,836, a difference of 25.4%.
Householder Income Ages 25 - 44 years Correlation Summary
| Measurement | Immigrants from Malaysia | Pennsylvania German |
| Minimum | $34,268 | $42,875 |
| Maximum | $197,953 | $121,909 |
| Range | $163,685 | $79,034 |
| Mean | $106,093 | $81,694 |
| Median | $104,675 | $82,382 |
| Interquartile 25% (IQ1) | $85,164 | $72,120 |
| Interquartile 75% (IQ3) | $124,430 | $87,825 |
| Interquartile Range (IQR) | $39,265 | $15,704 |
| Standard Deviation (Sample) | $35,722 | $15,048 |
| Standard Deviation (Population) | $35,413 | $14,918 |
Similar Demographics by Householder Income Ages 25 - 44 years
Demographics Similar to Immigrants from Malaysia by Householder Income Ages 25 - 44 years
In terms of householder income ages 25 - 44 years, the demographic groups most similar to Immigrants from Malaysia are Immigrants from Indonesia ($107,627, a difference of 0.020%), Israeli ($107,579, a difference of 0.070%), Australian ($107,912, a difference of 0.24%), Immigrants from Belarus ($107,393, a difference of 0.24%), and Estonian ($107,269, a difference of 0.36%).
| Demographics | Rating | Rank | Householder Income Ages 25 - 44 years |
| Latvians | 100.0 /100 | #36 | Exceptional $108,926 |
| Immigrants | Russia | 100.0 /100 | #37 | Exceptional $108,751 |
| Soviet Union | 100.0 /100 | #38 | Exceptional $108,457 |
| Immigrants | France | 99.9 /100 | #39 | Exceptional $108,257 |
| Immigrants | Lithuania | 99.9 /100 | #40 | Exceptional $108,149 |
| Immigrants | Bolivia | 99.9 /100 | #41 | Exceptional $108,128 |
| Australians | 99.9 /100 | #42 | Exceptional $107,912 |
| Immigrants | Malaysia | 99.9 /100 | #43 | Exceptional $107,650 |
| Immigrants | Indonesia | 99.9 /100 | #44 | Exceptional $107,627 |
| Israelis | 99.9 /100 | #45 | Exceptional $107,579 |
| Immigrants | Belarus | 99.9 /100 | #46 | Exceptional $107,393 |
| Estonians | 99.9 /100 | #47 | Exceptional $107,269 |
| Bulgarians | 99.9 /100 | #48 | Exceptional $107,264 |
| Immigrants | Turkey | 99.9 /100 | #49 | Exceptional $107,258 |
| Cambodians | 99.9 /100 | #50 | Exceptional $107,148 |
Demographics Similar to Pennsylvania Germans by Householder Income Ages 25 - 44 years
In terms of householder income ages 25 - 44 years, the demographic groups most similar to Pennsylvania Germans are French American Indian ($85,899, a difference of 0.070%), Cape Verdean ($85,758, a difference of 0.090%), Immigrants from Western Africa ($85,676, a difference of 0.19%), Immigrants from Sudan ($86,109, a difference of 0.32%), and British West Indian ($85,565, a difference of 0.32%).
| Demographics | Rating | Rank | Householder Income Ages 25 - 44 years |
| Immigrants | West Indies | 1.5 /100 | #243 | Tragic $87,063 |
| Immigrants | Venezuela | 1.5 /100 | #244 | Tragic $87,038 |
| Immigrants | El Salvador | 1.4 /100 | #245 | Tragic $86,913 |
| Immigrants | Burma/Myanmar | 1.3 /100 | #246 | Tragic $86,736 |
| Immigrants | Nigeria | 1.2 /100 | #247 | Tragic $86,589 |
| Immigrants | Sudan | 0.9 /100 | #248 | Tragic $86,109 |
| French American Indians | 0.8 /100 | #249 | Tragic $85,899 |
| Pennsylvania Germans | 0.8 /100 | #250 | Tragic $85,836 |
| Cape Verdeans | 0.8 /100 | #251 | Tragic $85,758 |
| Immigrants | Western Africa | 0.7 /100 | #252 | Tragic $85,676 |
| British West Indians | 0.7 /100 | #253 | Tragic $85,565 |
| Immigrants | Laos | 0.7 /100 | #254 | Tragic $85,553 |
| German Russians | 0.6 /100 | #255 | Tragic $85,220 |
| Central Americans | 0.5 /100 | #256 | Tragic $85,144 |
| Mexican American Indians | 0.5 /100 | #257 | Tragic $85,066 |