Okinawan vs Vietnamese College, Under 1 year
COMPARE
Okinawan
Vietnamese
College, Under 1 year
College, Under 1 year Comparison
Okinawans
Vietnamese
73.7%
COLLEGE, UNDER 1 YEAR
100.0/ 100
METRIC RATING
7th/ 347
METRIC RANK
61.7%
COLLEGE, UNDER 1 YEAR
0.5/ 100
METRIC RATING
249th/ 347
METRIC RANK
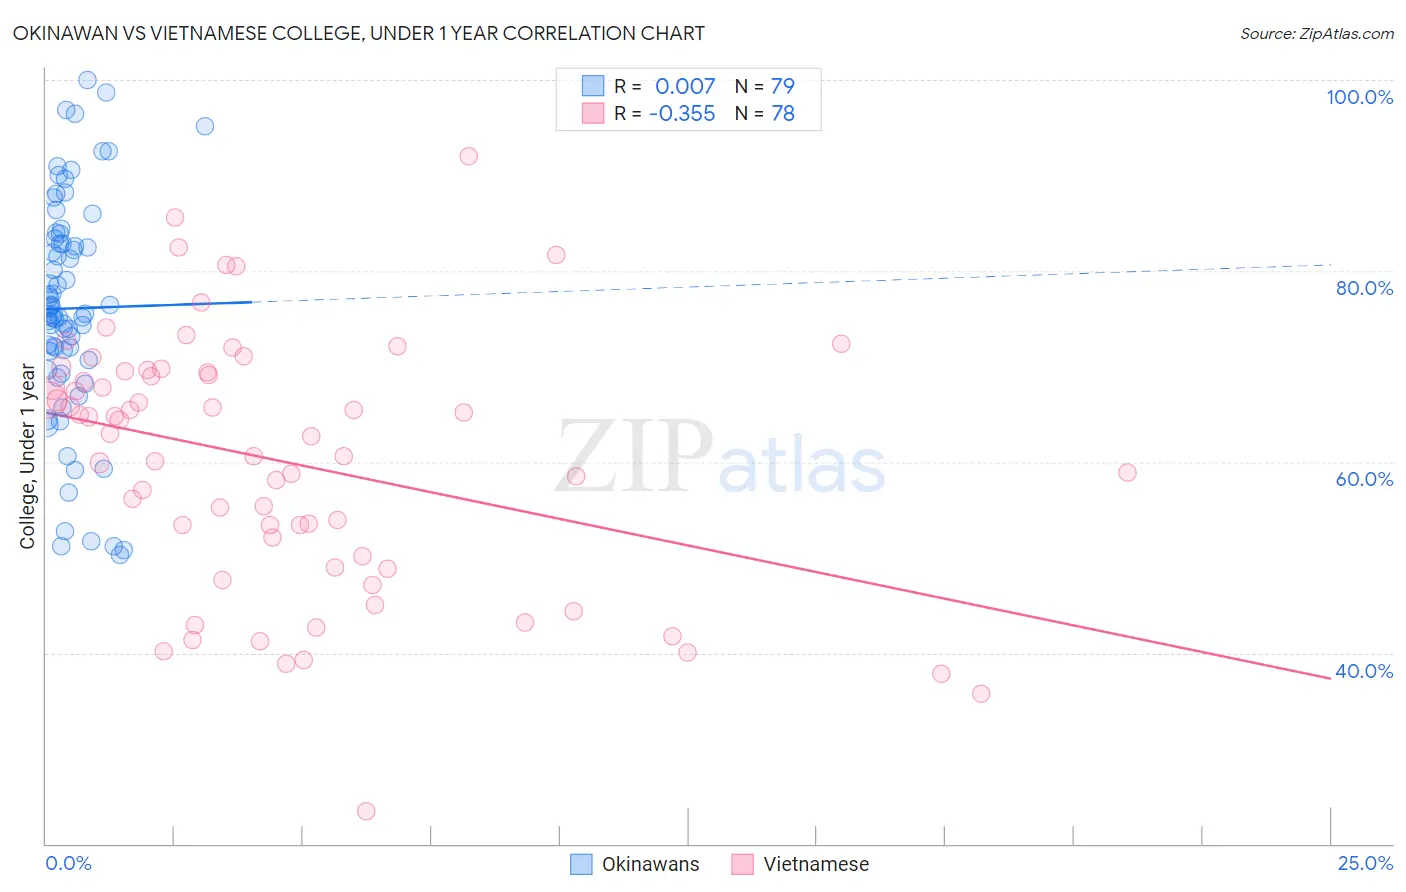
Okinawan vs Vietnamese College, Under 1 year Correlation Chart
The statistical analysis conducted on geographies consisting of 73,779,368 people shows no correlation between the proportion of Okinawans and percentage of population with at least college, under 1 year education in the United States with a correlation coefficient (R) of 0.007 and weighted average of 73.7%. Similarly, the statistical analysis conducted on geographies consisting of 170,751,543 people shows a mild negative correlation between the proportion of Vietnamese and percentage of population with at least college, under 1 year education in the United States with a correlation coefficient (R) of -0.355 and weighted average of 61.7%, a difference of 19.5%.
College, Under 1 year Correlation Summary
| Measurement | Okinawan | Vietnamese |
| Minimum | 50.3% | 23.5% |
| Maximum | 100.0% | 92.0% |
| Range | 49.7% | 68.6% |
| Mean | 76.1% | 60.1% |
| Median | 75.5% | 62.8% |
| Interquartile 25% (IQ1) | 70.6% | 50.1% |
| Interquartile 75% (IQ3) | 83.3% | 69.4% |
| Interquartile Range (IQR) | 12.7% | 19.3% |
| Standard Deviation (Sample) | 11.7% | 13.4% |
| Standard Deviation (Population) | 11.7% | 13.3% |
Similar Demographics by College, Under 1 year
Demographics Similar to Okinawans by College, Under 1 year
In terms of college, under 1 year, the demographic groups most similar to Okinawans are Thai (73.4%, a difference of 0.33%), Immigrants from Taiwan (74.2%, a difference of 0.70%), Immigrants from Iran (74.3%, a difference of 0.80%), Immigrants from India (74.4%, a difference of 1.0%), and Immigrants from Australia (72.7%, a difference of 1.3%).
| Demographics | Rating | Rank | College, Under 1 year |
| Filipinos | 100.0 /100 | #1 | Exceptional 75.5% |
| Iranians | 100.0 /100 | #2 | Exceptional 74.9% |
| Immigrants | Singapore | 100.0 /100 | #3 | Exceptional 74.8% |
| Immigrants | India | 100.0 /100 | #4 | Exceptional 74.4% |
| Immigrants | Iran | 100.0 /100 | #5 | Exceptional 74.3% |
| Immigrants | Taiwan | 100.0 /100 | #6 | Exceptional 74.2% |
| Okinawans | 100.0 /100 | #7 | Exceptional 73.7% |
| Thais | 100.0 /100 | #8 | Exceptional 73.4% |
| Immigrants | Australia | 100.0 /100 | #9 | Exceptional 72.7% |
| Immigrants | Israel | 100.0 /100 | #10 | Exceptional 72.3% |
| Immigrants | South Central Asia | 100.0 /100 | #11 | Exceptional 72.1% |
| Immigrants | Sweden | 100.0 /100 | #12 | Exceptional 72.1% |
| Cypriots | 100.0 /100 | #13 | Exceptional 72.0% |
| Cambodians | 100.0 /100 | #14 | Exceptional 71.9% |
| Burmese | 100.0 /100 | #15 | Exceptional 71.9% |
Demographics Similar to Vietnamese by College, Under 1 year
In terms of college, under 1 year, the demographic groups most similar to Vietnamese are Immigrants from Congo (61.7%, a difference of 0.0%), Potawatomi (61.8%, a difference of 0.16%), Immigrants from Micronesia (61.5%, a difference of 0.19%), West Indian (61.5%, a difference of 0.30%), and Japanese (61.5%, a difference of 0.30%).
| Demographics | Rating | Rank | College, Under 1 year |
| Malaysians | 1.1 /100 | #242 | Tragic 62.2% |
| Hawaiians | 1.1 /100 | #243 | Tragic 62.1% |
| Colville | 1.0 /100 | #244 | Tragic 62.1% |
| Delaware | 0.9 /100 | #245 | Tragic 62.1% |
| Marshallese | 0.8 /100 | #246 | Tragic 61.9% |
| Immigrants | Liberia | 0.8 /100 | #247 | Tragic 61.9% |
| Potawatomi | 0.6 /100 | #248 | Tragic 61.8% |
| Vietnamese | 0.5 /100 | #249 | Tragic 61.7% |
| Immigrants | Congo | 0.5 /100 | #250 | Tragic 61.7% |
| Immigrants | Micronesia | 0.5 /100 | #251 | Tragic 61.5% |
| West Indians | 0.4 /100 | #252 | Tragic 61.5% |
| Japanese | 0.4 /100 | #253 | Tragic 61.5% |
| Immigrants | Cambodia | 0.4 /100 | #254 | Tragic 61.5% |
| Comanche | 0.4 /100 | #255 | Tragic 61.4% |
| Bangladeshis | 0.4 /100 | #256 | Tragic 61.4% |