Immigrants from Laos vs Vietnamese Single Father Households
COMPARE
Immigrants from Laos
Vietnamese
Single Father Households
Single Father Households Comparison
Immigrants from Laos
Vietnamese
2.9%
SINGLE FATHER HOUSEHOLDS
0.0/ 100
METRIC RATING
310th/ 347
METRIC RANK
2.0%
SINGLE FATHER HOUSEHOLDS
99.9/ 100
METRIC RATING
61st/ 347
METRIC RANK
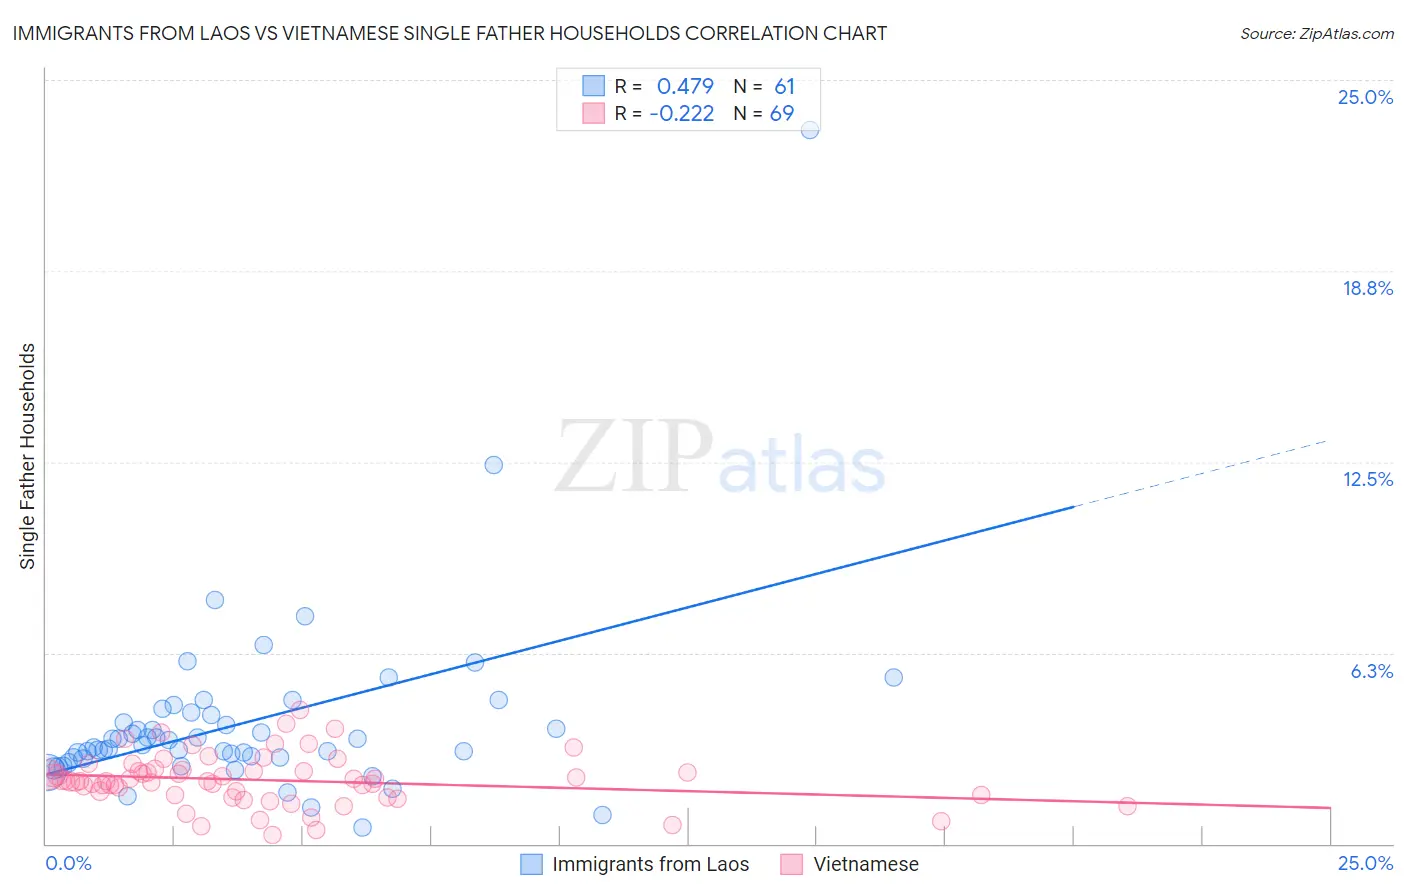
Immigrants from Laos vs Vietnamese Single Father Households Correlation Chart
The statistical analysis conducted on geographies consisting of 201,026,896 people shows a moderate positive correlation between the proportion of Immigrants from Laos and percentage of single father households in the United States with a correlation coefficient (R) of 0.479 and weighted average of 2.9%. Similarly, the statistical analysis conducted on geographies consisting of 170,091,169 people shows a weak negative correlation between the proportion of Vietnamese and percentage of single father households in the United States with a correlation coefficient (R) of -0.222 and weighted average of 2.0%, a difference of 40.1%.
Single Father Households Correlation Summary
| Measurement | Immigrants from Laos | Vietnamese |
| Minimum | 0.53% | 0.28% |
| Maximum | 23.4% | 4.4% |
| Range | 22.8% | 4.1% |
| Mean | 4.0% | 2.1% |
| Median | 3.2% | 2.1% |
| Interquartile 25% (IQ1) | 2.8% | 1.6% |
| Interquartile 75% (IQ3) | 4.3% | 2.4% |
| Interquartile Range (IQR) | 1.5% | 0.79% |
| Standard Deviation (Sample) | 3.1% | 0.82% |
| Standard Deviation (Population) | 3.1% | 0.82% |
Similar Demographics by Single Father Households
Demographics Similar to Immigrants from Laos by Single Father Households
In terms of single father households, the demographic groups most similar to Immigrants from Laos are Central American (2.9%, a difference of 0.21%), Spanish American Indian (2.9%, a difference of 0.48%), Apache (2.8%, a difference of 0.92%), Tsimshian (2.9%, a difference of 1.1%), and Hopi (2.8%, a difference of 1.1%).
| Demographics | Rating | Rank | Single Father Households |
| Immigrants | Honduras | 0.0 /100 | #303 | Tragic 2.8% |
| Mexican American Indians | 0.0 /100 | #304 | Tragic 2.8% |
| Hispanics or Latinos | 0.0 /100 | #305 | Tragic 2.8% |
| Immigrants | Azores | 0.0 /100 | #306 | Tragic 2.8% |
| Hopi | 0.0 /100 | #307 | Tragic 2.8% |
| Apache | 0.0 /100 | #308 | Tragic 2.8% |
| Central Americans | 0.0 /100 | #309 | Tragic 2.9% |
| Immigrants | Laos | 0.0 /100 | #310 | Tragic 2.9% |
| Spanish American Indians | 0.0 /100 | #311 | Tragic 2.9% |
| Tsimshian | 0.0 /100 | #312 | Tragic 2.9% |
| Arapaho | 0.0 /100 | #313 | Tragic 2.9% |
| Salvadorans | 0.0 /100 | #314 | Tragic 2.9% |
| Cheyenne | 0.0 /100 | #315 | Tragic 2.9% |
| Houma | 0.0 /100 | #316 | Tragic 2.9% |
| Immigrants | El Salvador | 0.0 /100 | #317 | Tragic 2.9% |
Demographics Similar to Vietnamese by Single Father Households
In terms of single father households, the demographic groups most similar to Vietnamese are Immigrants from Malaysia (2.0%, a difference of 0.20%), Immigrants from Austria (2.0%, a difference of 0.24%), Immigrants from North Macedonia (2.0%, a difference of 0.25%), Immigrants from Czechoslovakia (2.0%, a difference of 0.35%), and Burmese (2.0%, a difference of 0.38%).
| Demographics | Rating | Rank | Single Father Households |
| Immigrants | Korea | 99.9 /100 | #54 | Exceptional 2.0% |
| Immigrants | France | 99.9 /100 | #55 | Exceptional 2.0% |
| Immigrants | Norway | 99.9 /100 | #56 | Exceptional 2.0% |
| Burmese | 99.9 /100 | #57 | Exceptional 2.0% |
| Immigrants | Czechoslovakia | 99.9 /100 | #58 | Exceptional 2.0% |
| Immigrants | North Macedonia | 99.9 /100 | #59 | Exceptional 2.0% |
| Immigrants | Austria | 99.9 /100 | #60 | Exceptional 2.0% |
| Vietnamese | 99.9 /100 | #61 | Exceptional 2.0% |
| Immigrants | Malaysia | 99.9 /100 | #62 | Exceptional 2.0% |
| Maltese | 99.9 /100 | #63 | Exceptional 2.0% |
| Mongolians | 99.9 /100 | #64 | Exceptional 2.1% |
| Paraguayans | 99.9 /100 | #65 | Exceptional 2.1% |
| Immigrants | Western Asia | 99.8 /100 | #66 | Exceptional 2.1% |
| Immigrants | Italy | 99.8 /100 | #67 | Exceptional 2.1% |
| Immigrants | Denmark | 99.8 /100 | #68 | Exceptional 2.1% |