Sudanese vs Vietnamese College, Under 1 year
COMPARE
Sudanese
Vietnamese
College, Under 1 year
College, Under 1 year Comparison
Sudanese
Vietnamese
66.2%
COLLEGE, UNDER 1 YEAR
74.1/ 100
METRIC RATING
152nd/ 347
METRIC RANK
61.7%
COLLEGE, UNDER 1 YEAR
0.5/ 100
METRIC RATING
249th/ 347
METRIC RANK
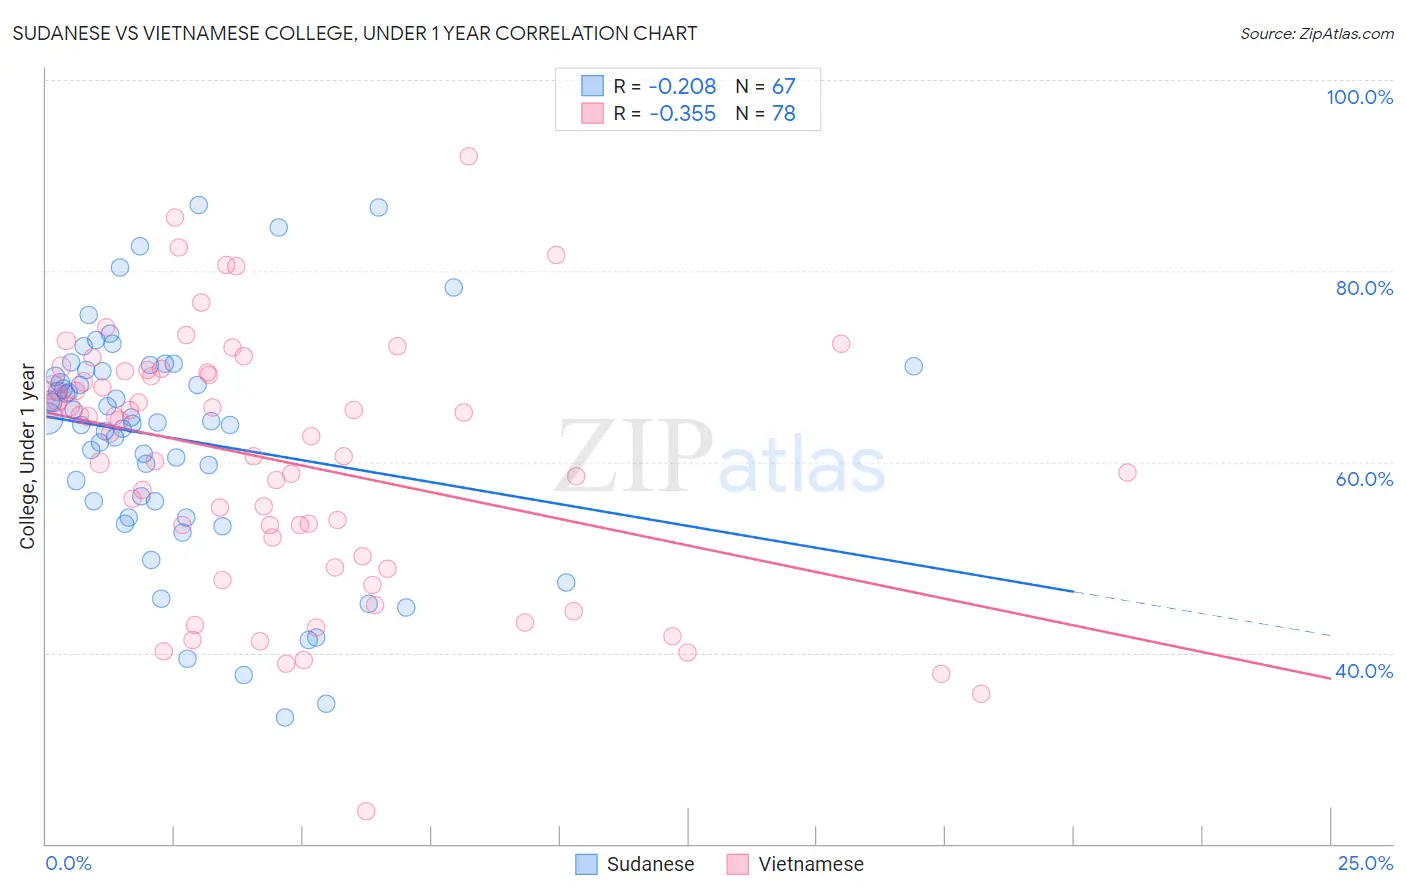
Sudanese vs Vietnamese College, Under 1 year Correlation Chart
The statistical analysis conducted on geographies consisting of 110,147,273 people shows a weak negative correlation between the proportion of Sudanese and percentage of population with at least college, under 1 year education in the United States with a correlation coefficient (R) of -0.208 and weighted average of 66.2%. Similarly, the statistical analysis conducted on geographies consisting of 170,751,543 people shows a mild negative correlation between the proportion of Vietnamese and percentage of population with at least college, under 1 year education in the United States with a correlation coefficient (R) of -0.355 and weighted average of 61.7%, a difference of 7.3%.
College, Under 1 year Correlation Summary
| Measurement | Sudanese | Vietnamese |
| Minimum | 33.2% | 23.5% |
| Maximum | 86.9% | 92.0% |
| Range | 53.7% | 68.6% |
| Mean | 62.5% | 60.1% |
| Median | 64.3% | 62.8% |
| Interquartile 25% (IQ1) | 55.9% | 50.1% |
| Interquartile 75% (IQ3) | 69.7% | 69.4% |
| Interquartile Range (IQR) | 13.8% | 19.3% |
| Standard Deviation (Sample) | 12.0% | 13.4% |
| Standard Deviation (Population) | 11.9% | 13.3% |
Similar Demographics by College, Under 1 year
Demographics Similar to Sudanese by College, Under 1 year
In terms of college, under 1 year, the demographic groups most similar to Sudanese are Belgian (66.2%, a difference of 0.020%), Immigrants from Sudan (66.2%, a difference of 0.11%), Immigrants from Eritrea (66.1%, a difference of 0.12%), Immigrants from Iraq (66.3%, a difference of 0.18%), and Irish (66.0%, a difference of 0.21%).
| Demographics | Rating | Rank | College, Under 1 year |
| Immigrants | Kenya | 81.8 /100 | #145 | Excellent 66.5% |
| Kenyans | 81.7 /100 | #146 | Excellent 66.5% |
| Immigrants | Morocco | 81.7 /100 | #147 | Excellent 66.5% |
| Taiwanese | 78.6 /100 | #148 | Good 66.4% |
| Immigrants | Venezuela | 77.9 /100 | #149 | Good 66.3% |
| Immigrants | Iraq | 77.1 /100 | #150 | Good 66.3% |
| Immigrants | Sudan | 76.0 /100 | #151 | Good 66.2% |
| Sudanese | 74.1 /100 | #152 | Good 66.2% |
| Belgians | 73.7 /100 | #153 | Good 66.2% |
| Immigrants | Eritrea | 71.9 /100 | #154 | Good 66.1% |
| Irish | 70.3 /100 | #155 | Good 66.0% |
| Welsh | 69.9 /100 | #156 | Good 66.0% |
| Sierra Leoneans | 67.8 /100 | #157 | Good 66.0% |
| Celtics | 67.3 /100 | #158 | Good 65.9% |
| Tlingit-Haida | 66.4 /100 | #159 | Good 65.9% |
Demographics Similar to Vietnamese by College, Under 1 year
In terms of college, under 1 year, the demographic groups most similar to Vietnamese are Immigrants from Congo (61.7%, a difference of 0.0%), Potawatomi (61.8%, a difference of 0.16%), Immigrants from Micronesia (61.5%, a difference of 0.19%), West Indian (61.5%, a difference of 0.30%), and Japanese (61.5%, a difference of 0.30%).
| Demographics | Rating | Rank | College, Under 1 year |
| Malaysians | 1.1 /100 | #242 | Tragic 62.2% |
| Hawaiians | 1.1 /100 | #243 | Tragic 62.1% |
| Colville | 1.0 /100 | #244 | Tragic 62.1% |
| Delaware | 0.9 /100 | #245 | Tragic 62.1% |
| Marshallese | 0.8 /100 | #246 | Tragic 61.9% |
| Immigrants | Liberia | 0.8 /100 | #247 | Tragic 61.9% |
| Potawatomi | 0.6 /100 | #248 | Tragic 61.8% |
| Vietnamese | 0.5 /100 | #249 | Tragic 61.7% |
| Immigrants | Congo | 0.5 /100 | #250 | Tragic 61.7% |
| Immigrants | Micronesia | 0.5 /100 | #251 | Tragic 61.5% |
| West Indians | 0.4 /100 | #252 | Tragic 61.5% |
| Japanese | 0.4 /100 | #253 | Tragic 61.5% |
| Immigrants | Cambodia | 0.4 /100 | #254 | Tragic 61.5% |
| Comanche | 0.4 /100 | #255 | Tragic 61.4% |
| Bangladeshis | 0.4 /100 | #256 | Tragic 61.4% |