Kiowa vs Vietnamese College, Under 1 year

COMPARE

Kiowa
Race
Ancestry
AfghanAfricanAlaska NativeAlaskan AthabascanAlbanianAleutAlsatianAmericanApacheArabArapahoArgentineanArmenianAssyrian/Chaldean/SyriacAustralianAustrianBahamianBangladeshiBarbadianBasqueBelgianBelizeanBermudanBhutaneseBlackfeetBolivianBrazilianBritishBritish West IndianBulgarianBurmeseCajunCambodianCanadianCape VerdeanCarpatho RusynCelticCentral AmericanCentral American IndianCherokeeCheyenneChickasawChileanChineseChippewaChoctawColombianColvilleComancheCosta RicanCreeCreekCroatianCrowCubanCypriotCzechCzechoslovakianDanishDelawareDominicanDutchDutch West IndianEastern EuropeanEcuadorianEgyptianEnglishEstonianEthiopianEuropeanFijianFilipinoFinnishFrenchFrench American IndianFrench CanadianGermanGerman RussianGhanaianGreekGuamanian/ChamorroGuatemalanGuyaneseHaitianHmongHonduranHopiHoumaHungarianIcelanderIndian (Asian)IndonesianInupiatIranianIraqiIrishIroquoisIsraeliItalianJamaicanJapaneseJordanianKenyanKiowaKoreanLaotianLatvianLebaneseLiberianLithuanianLumbeeLuxembourgerMacedonianMalaysianMalteseMarshalleseMenomineeMexicanMexican American IndianMongolianMoroccanNative HawaiianNavajoNepaleseNew ZealanderNicaraguanNigerianNorthern EuropeanNorwegianOkinawanOsageOttawaPaiutePakistaniPalestinianPanamanianParaguayanPennsylvania GermanPeruvianPimaPolishPortuguesePotawatomiPuebloPuerto RicanPuget Sound SalishRomanianRussianSalvadoranSamoanScandinavianScotch-IrishScottishSeminoleSenegaleseSerbianShoshoneSierra LeoneanSiouxSlavicSlovakSloveneSomaliSouth AfricanSouth AmericanSouth American IndianSoviet UnionSpaniardSpanishSpanish AmericanSpanish American IndianSri LankanSubsaharan AfricanSudaneseSwedishSwissSyrianTaiwaneseThaiTlingit-HaidaTohono O'OdhamTonganTrinidadian and TobagonianTsimshianTurkishU.S. Virgin IslanderUgandanUkrainianUruguayanUteVenezuelanWelshWest IndianYakamaYaquiYugoslavianYumanYup'ikZimbabwean
Immigration
NonimmigrantsImmigrantsAfghanistanAfricaAlbaniaArgentinaArmeniaAsiaAustraliaAustriaBahamasBangladeshBarbadosBelarusBelgiumBelizeBoliviaBosnia and HerzegovinaBrazilBulgariaBurma/MyanmarCabo VerdeCambodiaCameroonCanadaCaribbeanCentral AmericaChileChinaColombiaCongoCosta RicaCroatiaCubaCzechoslovakiaDenmarkDominicaDominican RepublicEastern AfricaEastern AsiaEastern EuropeEcuadorEgyptEl SalvadorEnglandEritreaEthiopiaEuropeFijiFranceGermanyGhanaGreeceGrenadaGuatemalaGuyanaHaitiHondurasHong KongHungaryIndiaIndonesiaIranIraqIrelandIsraelItalyJamaicaJapanJordanKazakhstanKenyaKoreaKuwaitLaosLatin AmericaLatviaLebanonLiberiaLithuaniaMalaysiaMexicoMicronesiaMiddle AfricaMoldovaMoroccoNepalNetherlandsNicaraguaNigeriaNorth AmericaNorth MacedoniaNorthern AfricaNorthern EuropeNorwayOceaniaPakistanPanamaPeruPhilippinesPolandPortugalRomaniaRussiaSaudi ArabiaScotlandSenegalSerbiaSierra LeoneSingaporeSomaliaSouth AfricaSouth AmericaSouth Central AsiaSouth Eastern AsiaSouthern EuropeSpainSri LankaSt. Vincent and the GrenadinesSudanSwedenSwitzerlandSyriaTaiwanThailandTrinidad and TobagoTurkeyUgandaUkraineUruguayUzbekistanVenezuelaVietnamWest IndiesWestern AfricaWestern AsiaWestern EuropeYemenZaireZimbabweAzores
Vietnamese
Race
Ancestry
AfghanAfricanAlaska NativeAlaskan AthabascanAlbanianAleutAlsatianAmericanApacheArabArapahoArgentineanArmenianAssyrian/Chaldean/SyriacAustralianAustrianBahamianBangladeshiBarbadianBasqueBelgianBelizeanBermudanBhutaneseBlackfeetBolivianBrazilianBritishBritish West IndianBulgarianBurmeseCajunCambodianCanadianCape VerdeanCarpatho RusynCelticCentral AmericanCentral American IndianCherokeeCheyenneChickasawChileanChineseChippewaChoctawColombianColvilleComancheCosta RicanCreeCreekCroatianCrowCubanCypriotCzechCzechoslovakianDanishDelawareDominicanDutchDutch West IndianEastern EuropeanEcuadorianEgyptianEnglishEstonianEthiopianEuropeanFijianFilipinoFinnishFrenchFrench American IndianFrench CanadianGermanGerman RussianGhanaianGreekGuamanian/ChamorroGuatemalanGuyaneseHaitianHmongHonduranHopiHoumaHungarianIcelanderIndian (Asian)IndonesianInupiatIranianIraqiIrishIroquoisIsraeliItalianJamaicanJapaneseJordanianKenyanKoreanLaotianLatvianLebaneseLiberianLithuanianLumbeeLuxembourgerMacedonianMalaysianMalteseMarshalleseMenomineeMexicanMexican American IndianMongolianMoroccanNative HawaiianNavajoNepaleseNew ZealanderNicaraguanNigerianNorthern EuropeanNorwegianOkinawanOsageOttawaPaiutePakistaniPalestinianPanamanianParaguayanPennsylvania GermanPeruvianPimaPolishPortuguesePotawatomiPuebloPuerto RicanPuget Sound SalishRomanianRussianSalvadoranSamoanScandinavianScotch-IrishScottishSeminoleSenegaleseSerbianShoshoneSierra LeoneanSiouxSlavicSlovakSloveneSomaliSouth AfricanSouth AmericanSouth American IndianSoviet UnionSpaniardSpanishSpanish AmericanSpanish American IndianSri LankanSubsaharan AfricanSudaneseSwedishSwissSyrianTaiwaneseThaiTlingit-HaidaTohono O'OdhamTonganTrinidadian and TobagonianTsimshianTurkishU.S. Virgin IslanderUgandanUkrainianUruguayanUteVenezuelanVietnameseWelshWest IndianYakamaYaquiYugoslavianYumanYup'ikZimbabwean
Immigration
NonimmigrantsImmigrantsAfghanistanAfricaAlbaniaArgentinaArmeniaAsiaAustraliaAustriaBahamasBangladeshBarbadosBelarusBelgiumBelizeBoliviaBosnia and HerzegovinaBrazilBulgariaBurma/MyanmarCabo VerdeCambodiaCameroonCanadaCaribbeanCentral AmericaChileChinaColombiaCongoCosta RicaCroatiaCubaCzechoslovakiaDenmarkDominicaDominican RepublicEastern AfricaEastern AsiaEastern EuropeEcuadorEgyptEl SalvadorEnglandEritreaEthiopiaEuropeFijiFranceGermanyGhanaGreeceGrenadaGuatemalaGuyanaHaitiHondurasHong KongHungaryIndiaIndonesiaIranIraqIrelandIsraelItalyJamaicaJapanJordanKazakhstanKenyaKoreaKuwaitLaosLatin AmericaLatviaLebanonLiberiaLithuaniaMalaysiaMexicoMicronesiaMiddle AfricaMoldovaMoroccoNepalNetherlandsNicaraguaNigeriaNorth AmericaNorth MacedoniaNorthern AfricaNorthern EuropeNorwayOceaniaPakistanPanamaPeruPhilippinesPolandPortugalRomaniaRussiaSaudi ArabiaScotlandSenegalSerbiaSierra LeoneSingaporeSomaliaSouth AfricaSouth AmericaSouth Central AsiaSouth Eastern AsiaSouthern EuropeSpainSri LankaSt. Vincent and the GrenadinesSudanSwedenSwitzerlandSyriaTaiwanThailandTrinidad and TobagoTurkeyUgandaUkraineUruguayUzbekistanVenezuelaVietnamWest IndiesWestern AfricaWestern AsiaWestern EuropeYemenZaireZimbabweAzores
College, Under 1 year
Income
Poverty
Unemployment
Labor Participation
Family Structure
Vehicle Availability
Education Level
Disability

College, Under 1 year Comparison

Kiowa

Vietnamese

Tragic
Tragic
57.8%
COLLEGE, UNDER 1 YEAR
0.0/ 100
METRIC RATING
304th/ 347
METRIC RANK
61.7%
COLLEGE, UNDER 1 YEAR
0.5/ 100
METRIC RATING
249th/ 347
METRIC RANK

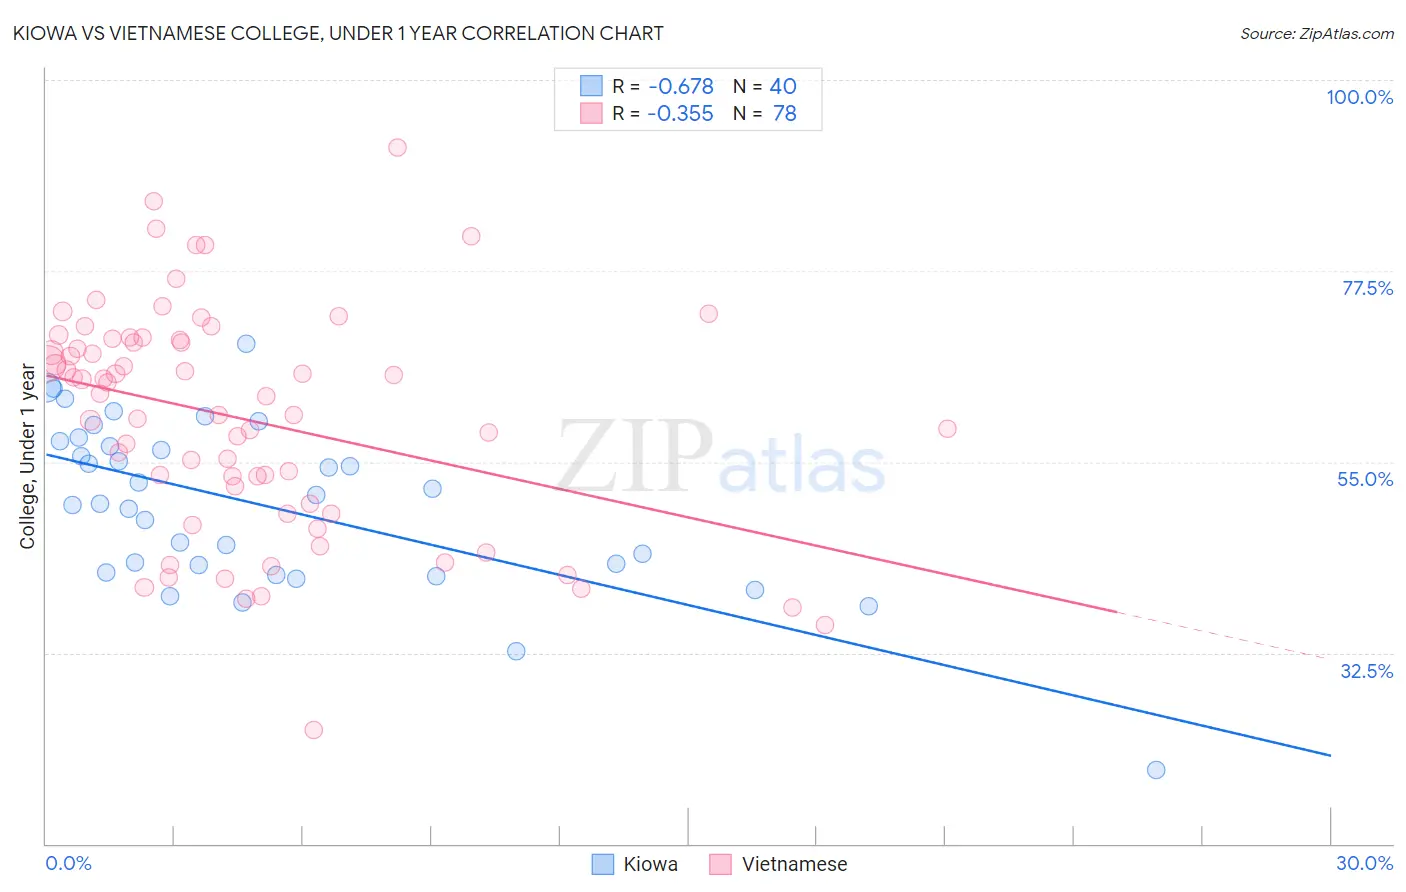
Kiowa vs Vietnamese College, Under 1 year Correlation Chart

The statistical analysis conducted on geographies consisting of 56,101,444 people shows a significant negative correlation between the proportion of Kiowa and percentage of population with at least college, under 1 year education in the United States with a correlation coefficient (R) of -0.678 and weighted average of 57.8%. Similarly, the statistical analysis conducted on geographies consisting of 170,751,543 people shows a mild negative correlation between the proportion of Vietnamese and percentage of population with at least college, under 1 year education in the United States with a correlation coefficient (R) of -0.355 and weighted average of 61.7%, a difference of 6.6%.
Kiowa vs Vietnamese College, Under 1 year

College, Under 1 year Correlation Summary

MeasurementKiowaVietnamese
Minimum18.8%23.5%
Maximum68.9%92.0%
Range50.2%68.6%
Mean49.8%60.1%
Median50.6%62.8%
Interquartile 25% (IQ1)42.4%50.1%
Interquartile 75% (IQ3)57.2%69.4%
Interquartile Range (IQR)14.8%19.3%
Standard Deviation (Sample)10.0%13.4%
Standard Deviation (Population)9.9%13.3%

Similar Demographics by College, Under 1 year

Demographics Similar to Kiowa by College, Under 1 year

In terms of college, under 1 year, the demographic groups most similar to Kiowa are Immigrants from Dominica (57.9%, a difference of 0.010%), Haitian (57.8%, a difference of 0.11%), Apache (58.0%, a difference of 0.30%), Immigrants from Portugal (57.7%, a difference of 0.31%), and Fijian (57.7%, a difference of 0.32%).
DemographicsRating | RankCollege, Under 1 year
Guyanese
0.0
/100
|
#297
Tragic
59.0%
Immigrants | Ecuador
0.0
/100
|
#298
Tragic
58.7%
Cubans
0.0
/100
|
#299
Tragic
58.6%
Immigrants | Guyana
0.0
/100
|
#300
Tragic
58.5%
Mexican American Indians
0.0
/100
|
#301
Tragic
58.1%
Apache
0.0
/100
|
#302
Tragic
58.0%
Immigrants | Dominica
0.0
/100
|
#303
Tragic
57.9%
Kiowa
0.0
/100
|
#304
Tragic
57.8%
Haitians
0.0
/100
|
#305
Tragic
57.8%
Immigrants | Portugal
0.0
/100
|
#306
Tragic
57.7%
Fijians
0.0
/100
|
#307
Tragic
57.7%
Central Americans
0.0
/100
|
#308
Tragic
57.7%
Immigrants | Nicaragua
0.0
/100
|
#309
Tragic
57.6%
Pueblo
0.0
/100
|
#310
Tragic
57.4%
Cajuns
0.0
/100
|
#311
Tragic
57.3%

Demographics Similar to Vietnamese by College, Under 1 year

In terms of college, under 1 year, the demographic groups most similar to Vietnamese are Immigrants from Congo (61.7%, a difference of 0.0%), Potawatomi (61.8%, a difference of 0.16%), Immigrants from Micronesia (61.5%, a difference of 0.19%), West Indian (61.5%, a difference of 0.30%), and Japanese (61.5%, a difference of 0.30%).
DemographicsRating | RankCollege, Under 1 year
Malaysians
1.1
/100
|
#242
Tragic
62.2%
Hawaiians
1.1
/100
|
#243
Tragic
62.1%
Colville
1.0
/100
|
#244
Tragic
62.1%
Delaware
0.9
/100
|
#245
Tragic
62.1%
Marshallese
0.8
/100
|
#246
Tragic
61.9%
Immigrants | Liberia
0.8
/100
|
#247
Tragic
61.9%
Potawatomi
0.6
/100
|
#248
Tragic
61.8%
Vietnamese
0.5
/100
|
#249
Tragic
61.7%
Immigrants | Congo
0.5
/100
|
#250
Tragic
61.7%
Immigrants | Micronesia
0.5
/100
|
#251
Tragic
61.5%
West Indians
0.4
/100
|
#252
Tragic
61.5%
Japanese
0.4
/100
|
#253
Tragic
61.5%
Immigrants | Cambodia
0.4
/100
|
#254
Tragic
61.5%
Comanche
0.4
/100
|
#255
Tragic
61.4%
Bangladeshis
0.4
/100
|
#256
Tragic
61.4%