Immigrants from Poland vs Peruvian College, Under 1 year
COMPARE
Immigrants from Poland
Peruvian
College, Under 1 year
College, Under 1 year Comparison
Immigrants from Poland
Peruvians
65.2%
COLLEGE, UNDER 1 YEAR
42.6/ 100
METRIC RATING
183rd/ 347
METRIC RANK
64.1%
COLLEGE, UNDER 1 YEAR
13.7/ 100
METRIC RATING
205th/ 347
METRIC RANK
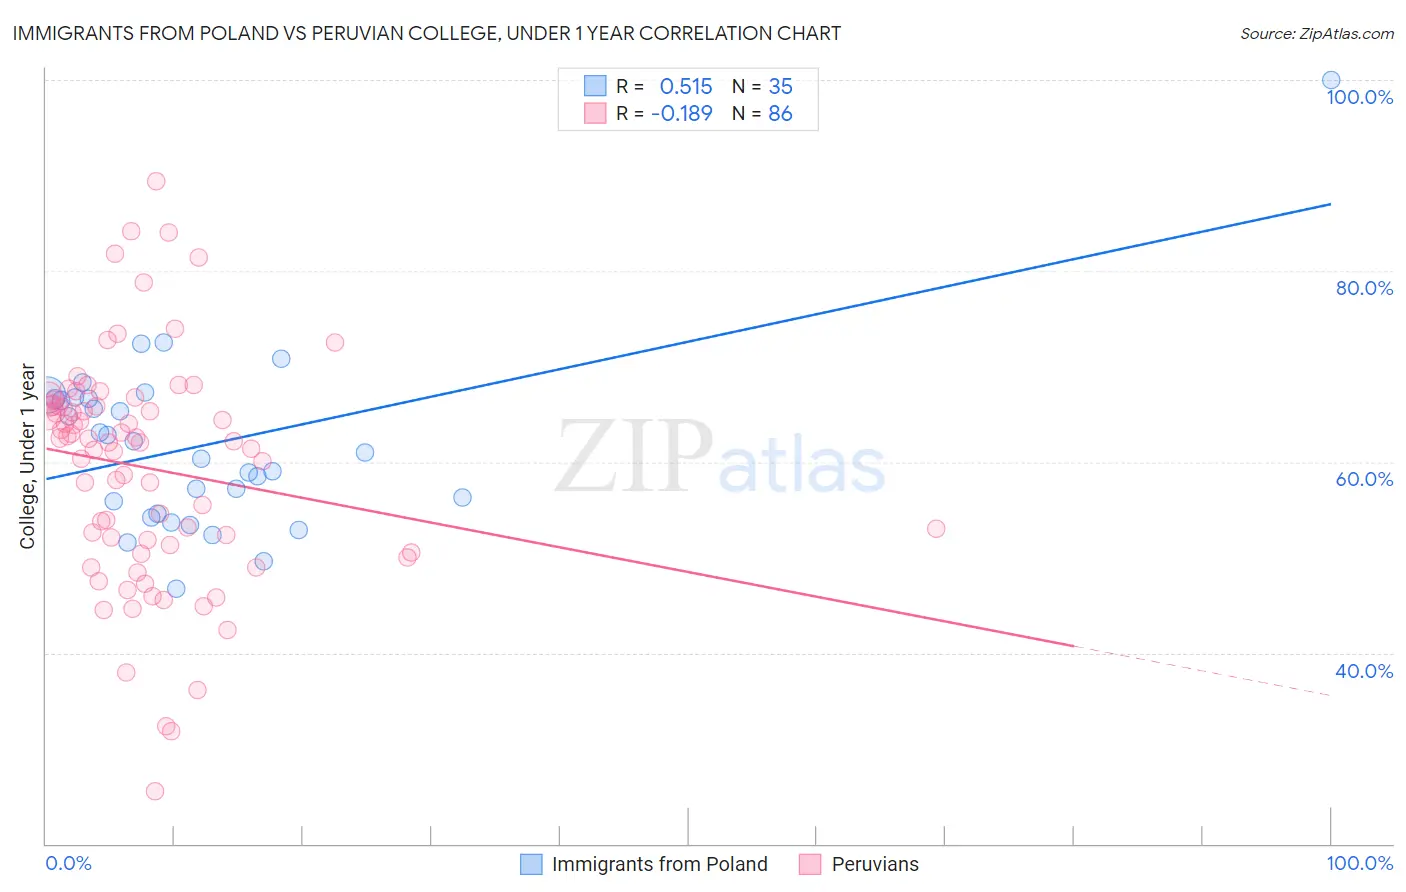
Immigrants from Poland vs Peruvian College, Under 1 year Correlation Chart
The statistical analysis conducted on geographies consisting of 304,861,877 people shows a substantial positive correlation between the proportion of Immigrants from Poland and percentage of population with at least college, under 1 year education in the United States with a correlation coefficient (R) of 0.515 and weighted average of 65.2%. Similarly, the statistical analysis conducted on geographies consisting of 363,248,867 people shows a poor negative correlation between the proportion of Peruvians and percentage of population with at least college, under 1 year education in the United States with a correlation coefficient (R) of -0.189 and weighted average of 64.1%, a difference of 1.7%.
College, Under 1 year Correlation Summary
| Measurement | Immigrants from Poland | Peruvian |
| Minimum | 46.7% | 25.5% |
| Maximum | 100.0% | 89.4% |
| Range | 53.3% | 63.9% |
| Mean | 61.8% | 59.4% |
| Median | 61.0% | 62.1% |
| Interquartile 25% (IQ1) | 54.6% | 51.3% |
| Interquartile 75% (IQ3) | 66.6% | 65.9% |
| Interquartile Range (IQR) | 12.0% | 14.6% |
| Standard Deviation (Sample) | 9.4% | 12.0% |
| Standard Deviation (Population) | 9.3% | 11.9% |
Similar Demographics by College, Under 1 year
Demographics Similar to Immigrants from Poland by College, Under 1 year
In terms of college, under 1 year, the demographic groups most similar to Immigrants from Poland are Bermudan (65.2%, a difference of 0.030%), Sri Lankan (65.2%, a difference of 0.040%), Immigrants from Africa (65.3%, a difference of 0.10%), Spaniard (65.3%, a difference of 0.13%), and Immigrants from Sierra Leone (65.1%, a difference of 0.13%).
| Demographics | Rating | Rank | College, Under 1 year |
| French | 48.9 /100 | #176 | Average 65.4% |
| Immigrants | North Macedonia | 48.6 /100 | #177 | Average 65.4% |
| German Russians | 48.3 /100 | #178 | Average 65.4% |
| Guamanians/Chamorros | 48.2 /100 | #179 | Average 65.4% |
| Dutch | 46.1 /100 | #180 | Average 65.3% |
| Spaniards | 45.5 /100 | #181 | Average 65.3% |
| Immigrants | Africa | 44.7 /100 | #182 | Average 65.3% |
| Immigrants | Poland | 42.6 /100 | #183 | Average 65.2% |
| Bermudans | 42.0 /100 | #184 | Average 65.2% |
| Sri Lankans | 41.7 /100 | #185 | Average 65.2% |
| Immigrants | Sierra Leone | 39.7 /100 | #186 | Fair 65.1% |
| Immigrants | Southern Europe | 34.3 /100 | #187 | Fair 64.9% |
| Immigrants | Albania | 32.0 /100 | #188 | Fair 64.9% |
| Spanish | 31.6 /100 | #189 | Fair 64.9% |
| Immigrants | Philippines | 30.1 /100 | #190 | Fair 64.8% |
Demographics Similar to Peruvians by College, Under 1 year
In terms of college, under 1 year, the demographic groups most similar to Peruvians are Immigrants from Zaire (64.1%, a difference of 0.080%), White/Caucasian (64.0%, a difference of 0.090%), Colombian (64.0%, a difference of 0.13%), Immigrants from Vietnam (64.0%, a difference of 0.16%), and Uruguayan (64.2%, a difference of 0.17%).
| Demographics | Rating | Rank | College, Under 1 year |
| Tsimshian | 17.9 /100 | #198 | Poor 64.3% |
| Panamanians | 17.0 /100 | #199 | Poor 64.3% |
| Nigerians | 16.7 /100 | #200 | Poor 64.3% |
| French Canadians | 16.3 /100 | #201 | Poor 64.2% |
| South Americans | 16.2 /100 | #202 | Poor 64.2% |
| Uruguayans | 15.6 /100 | #203 | Poor 64.2% |
| Immigrants | Zaire | 14.6 /100 | #204 | Poor 64.1% |
| Peruvians | 13.7 /100 | #205 | Poor 64.1% |
| Whites/Caucasians | 12.8 /100 | #206 | Poor 64.0% |
| Colombians | 12.4 /100 | #207 | Poor 64.0% |
| Immigrants | Vietnam | 12.1 /100 | #208 | Poor 64.0% |
| Puget Sound Salish | 11.3 /100 | #209 | Poor 63.9% |
| Ghanaians | 11.2 /100 | #210 | Poor 63.9% |
| Native Hawaiians | 10.6 /100 | #211 | Poor 63.9% |
| Immigrants | Middle Africa | 10.5 /100 | #212 | Poor 63.9% |