Bahamian vs Peruvian College, Under 1 year
COMPARE
Bahamian
Peruvian
College, Under 1 year
College, Under 1 year Comparison
Bahamians
Peruvians
60.3%
COLLEGE, UNDER 1 YEAR
0.1/ 100
METRIC RATING
277th/ 347
METRIC RANK
64.1%
COLLEGE, UNDER 1 YEAR
13.7/ 100
METRIC RATING
205th/ 347
METRIC RANK
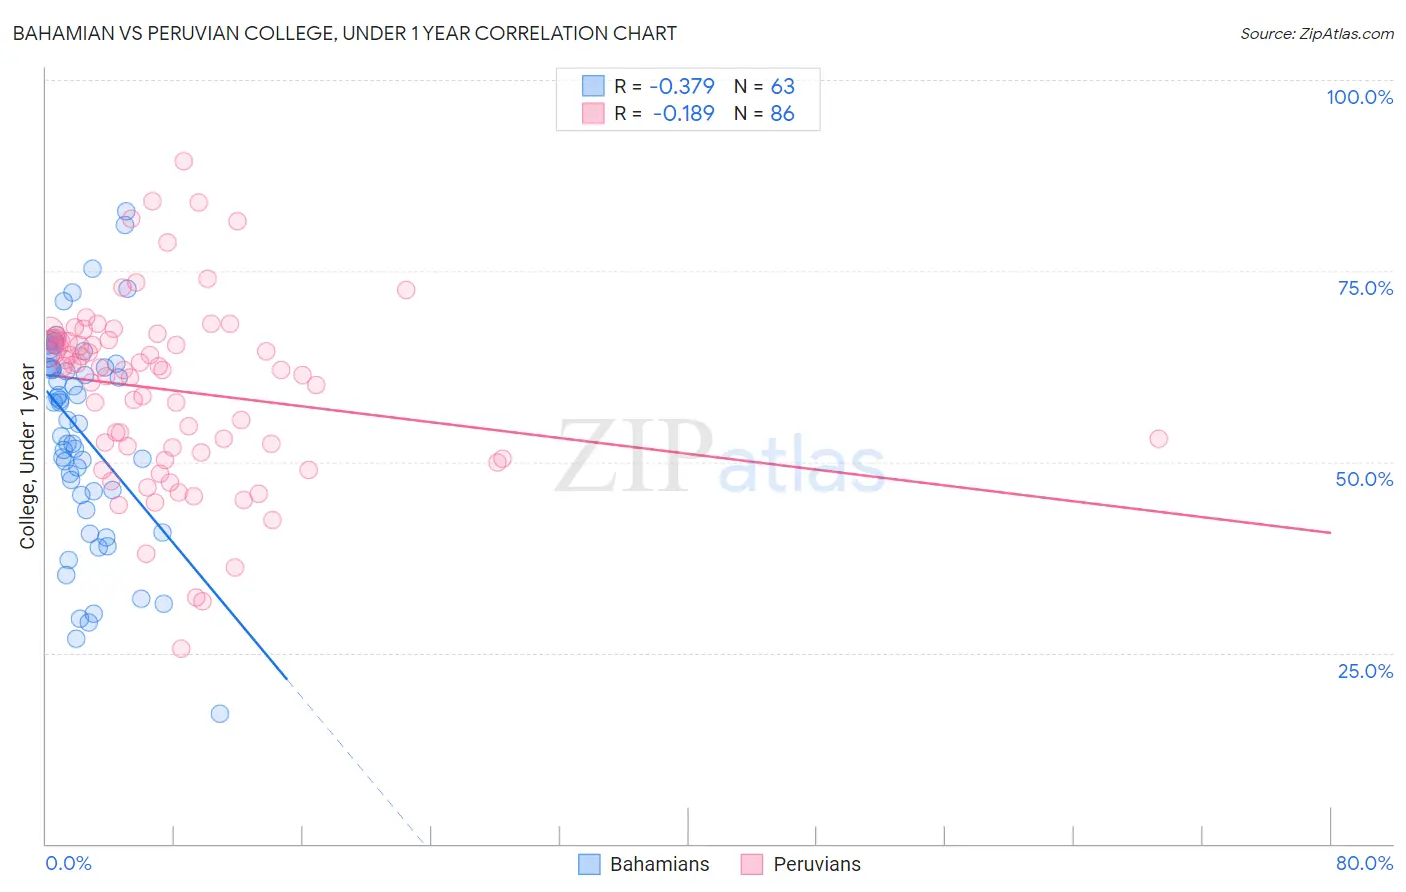
Bahamian vs Peruvian College, Under 1 year Correlation Chart
The statistical analysis conducted on geographies consisting of 112,705,508 people shows a mild negative correlation between the proportion of Bahamians and percentage of population with at least college, under 1 year education in the United States with a correlation coefficient (R) of -0.379 and weighted average of 60.3%. Similarly, the statistical analysis conducted on geographies consisting of 363,248,867 people shows a poor negative correlation between the proportion of Peruvians and percentage of population with at least college, under 1 year education in the United States with a correlation coefficient (R) of -0.189 and weighted average of 64.1%, a difference of 6.4%.
College, Under 1 year Correlation Summary
| Measurement | Bahamian | Peruvian |
| Minimum | 17.1% | 25.5% |
| Maximum | 82.8% | 89.4% |
| Range | 65.7% | 63.9% |
| Mean | 53.5% | 59.4% |
| Median | 55.5% | 62.1% |
| Interquartile 25% (IQ1) | 45.7% | 51.3% |
| Interquartile 75% (IQ3) | 62.4% | 65.9% |
| Interquartile Range (IQR) | 16.7% | 14.6% |
| Standard Deviation (Sample) | 13.8% | 12.0% |
| Standard Deviation (Population) | 13.7% | 11.9% |
Similar Demographics by College, Under 1 year
Demographics Similar to Bahamians by College, Under 1 year
In terms of college, under 1 year, the demographic groups most similar to Bahamians are Yaqui (60.2%, a difference of 0.030%), Ute (60.2%, a difference of 0.050%), Arapaho (60.3%, a difference of 0.14%), Crow (60.2%, a difference of 0.14%), and Immigrants from Barbados (60.4%, a difference of 0.17%).
| Demographics | Rating | Rank | College, Under 1 year |
| Cheyenne | 0.1 /100 | #270 | Tragic 60.6% |
| U.S. Virgin Islanders | 0.1 /100 | #271 | Tragic 60.6% |
| Jamaicans | 0.1 /100 | #272 | Tragic 60.5% |
| Chickasaw | 0.1 /100 | #273 | Tragic 60.4% |
| Alaska Natives | 0.1 /100 | #274 | Tragic 60.4% |
| Immigrants | Barbados | 0.1 /100 | #275 | Tragic 60.4% |
| Arapaho | 0.1 /100 | #276 | Tragic 60.3% |
| Bahamians | 0.1 /100 | #277 | Tragic 60.3% |
| Yaqui | 0.1 /100 | #278 | Tragic 60.2% |
| Ute | 0.1 /100 | #279 | Tragic 60.2% |
| Crow | 0.1 /100 | #280 | Tragic 60.2% |
| Cherokee | 0.1 /100 | #281 | Tragic 60.1% |
| Belizeans | 0.1 /100 | #282 | Tragic 60.1% |
| Immigrants | Jamaica | 0.0 /100 | #283 | Tragic 59.7% |
| Immigrants | St. Vincent and the Grenadines | 0.0 /100 | #284 | Tragic 59.6% |
Demographics Similar to Peruvians by College, Under 1 year
In terms of college, under 1 year, the demographic groups most similar to Peruvians are Immigrants from Zaire (64.1%, a difference of 0.080%), White/Caucasian (64.0%, a difference of 0.090%), Colombian (64.0%, a difference of 0.13%), Immigrants from Vietnam (64.0%, a difference of 0.16%), and Uruguayan (64.2%, a difference of 0.17%).
| Demographics | Rating | Rank | College, Under 1 year |
| Tsimshian | 17.9 /100 | #198 | Poor 64.3% |
| Panamanians | 17.0 /100 | #199 | Poor 64.3% |
| Nigerians | 16.7 /100 | #200 | Poor 64.3% |
| French Canadians | 16.3 /100 | #201 | Poor 64.2% |
| South Americans | 16.2 /100 | #202 | Poor 64.2% |
| Uruguayans | 15.6 /100 | #203 | Poor 64.2% |
| Immigrants | Zaire | 14.6 /100 | #204 | Poor 64.1% |
| Peruvians | 13.7 /100 | #205 | Poor 64.1% |
| Whites/Caucasians | 12.8 /100 | #206 | Poor 64.0% |
| Colombians | 12.4 /100 | #207 | Poor 64.0% |
| Immigrants | Vietnam | 12.1 /100 | #208 | Poor 64.0% |
| Puget Sound Salish | 11.3 /100 | #209 | Poor 63.9% |
| Ghanaians | 11.2 /100 | #210 | Poor 63.9% |
| Native Hawaiians | 10.6 /100 | #211 | Poor 63.9% |
| Immigrants | Middle Africa | 10.5 /100 | #212 | Poor 63.9% |