Thai vs Peruvian College, Under 1 year
COMPARE
Thai
Peruvian
College, Under 1 year
College, Under 1 year Comparison
Thais
Peruvians
73.4%
COLLEGE, UNDER 1 YEAR
100.0/ 100
METRIC RATING
8th/ 347
METRIC RANK
64.1%
COLLEGE, UNDER 1 YEAR
13.7/ 100
METRIC RATING
205th/ 347
METRIC RANK
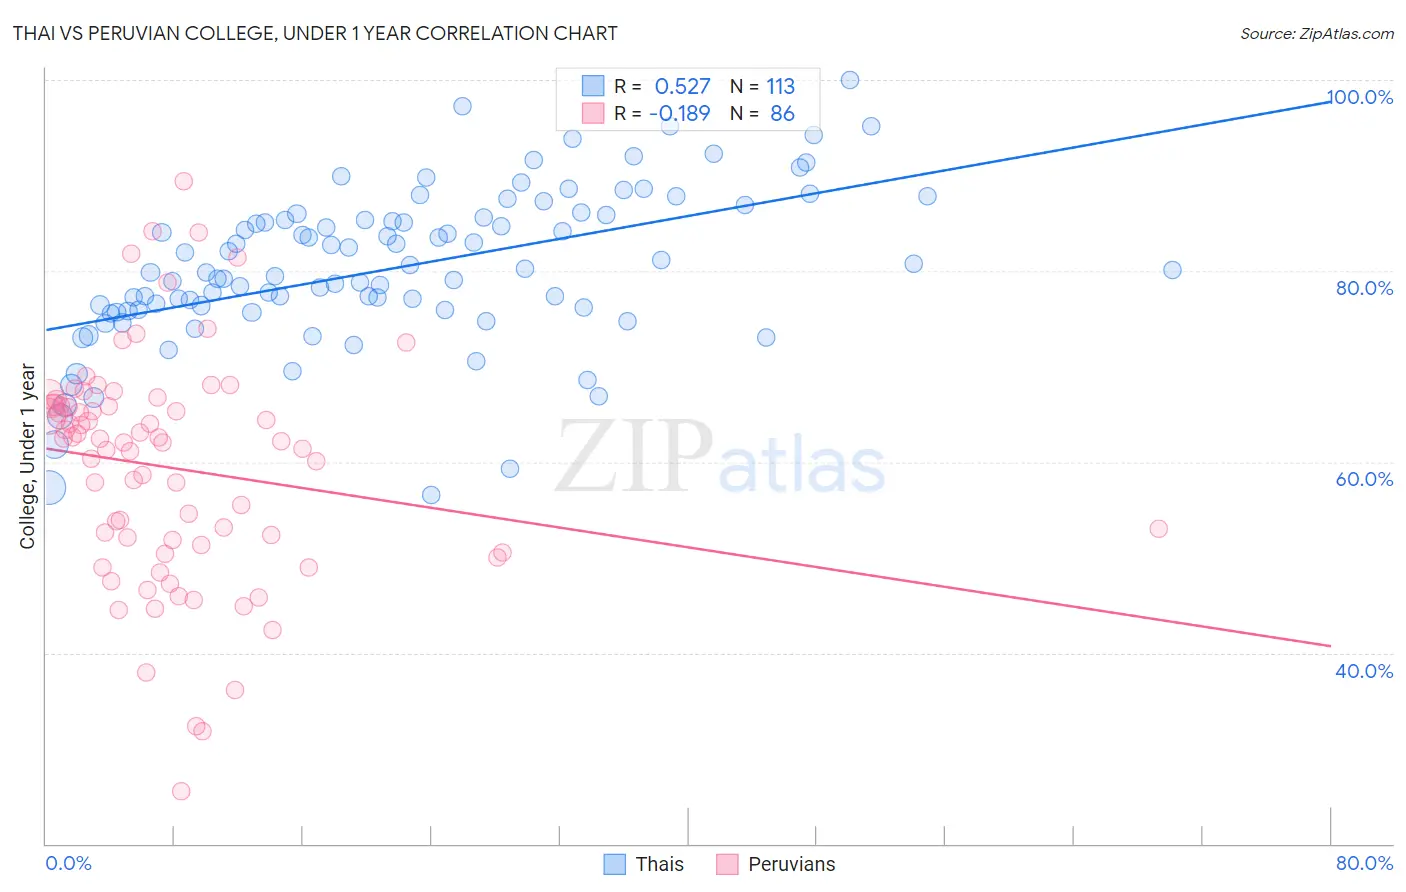
Thai vs Peruvian College, Under 1 year Correlation Chart
The statistical analysis conducted on geographies consisting of 475,810,175 people shows a substantial positive correlation between the proportion of Thais and percentage of population with at least college, under 1 year education in the United States with a correlation coefficient (R) of 0.527 and weighted average of 73.4%. Similarly, the statistical analysis conducted on geographies consisting of 363,248,867 people shows a poor negative correlation between the proportion of Peruvians and percentage of population with at least college, under 1 year education in the United States with a correlation coefficient (R) of -0.189 and weighted average of 64.1%, a difference of 14.6%.
College, Under 1 year Correlation Summary
| Measurement | Thai | Peruvian |
| Minimum | 56.5% | 25.5% |
| Maximum | 100.0% | 89.4% |
| Range | 43.5% | 63.9% |
| Mean | 80.3% | 59.4% |
| Median | 79.9% | 62.1% |
| Interquartile 25% (IQ1) | 75.8% | 51.3% |
| Interquartile 75% (IQ3) | 85.5% | 65.9% |
| Interquartile Range (IQR) | 9.6% | 14.6% |
| Standard Deviation (Sample) | 8.2% | 12.0% |
| Standard Deviation (Population) | 8.2% | 11.9% |
Similar Demographics by College, Under 1 year
Demographics Similar to Thais by College, Under 1 year
In terms of college, under 1 year, the demographic groups most similar to Thais are Okinawan (73.7%, a difference of 0.33%), Immigrants from Australia (72.7%, a difference of 0.95%), Immigrants from Taiwan (74.2%, a difference of 1.0%), Immigrants from Iran (74.3%, a difference of 1.1%), and Immigrants from India (74.4%, a difference of 1.4%).
| Demographics | Rating | Rank | College, Under 1 year |
| Filipinos | 100.0 /100 | #1 | Exceptional 75.5% |
| Iranians | 100.0 /100 | #2 | Exceptional 74.9% |
| Immigrants | Singapore | 100.0 /100 | #3 | Exceptional 74.8% |
| Immigrants | India | 100.0 /100 | #4 | Exceptional 74.4% |
| Immigrants | Iran | 100.0 /100 | #5 | Exceptional 74.3% |
| Immigrants | Taiwan | 100.0 /100 | #6 | Exceptional 74.2% |
| Okinawans | 100.0 /100 | #7 | Exceptional 73.7% |
| Thais | 100.0 /100 | #8 | Exceptional 73.4% |
| Immigrants | Australia | 100.0 /100 | #9 | Exceptional 72.7% |
| Immigrants | Israel | 100.0 /100 | #10 | Exceptional 72.3% |
| Immigrants | South Central Asia | 100.0 /100 | #11 | Exceptional 72.1% |
| Immigrants | Sweden | 100.0 /100 | #12 | Exceptional 72.1% |
| Cypriots | 100.0 /100 | #13 | Exceptional 72.0% |
| Cambodians | 100.0 /100 | #14 | Exceptional 71.9% |
| Burmese | 100.0 /100 | #15 | Exceptional 71.9% |
Demographics Similar to Peruvians by College, Under 1 year
In terms of college, under 1 year, the demographic groups most similar to Peruvians are Immigrants from Zaire (64.1%, a difference of 0.080%), White/Caucasian (64.0%, a difference of 0.090%), Colombian (64.0%, a difference of 0.13%), Immigrants from Vietnam (64.0%, a difference of 0.16%), and Uruguayan (64.2%, a difference of 0.17%).
| Demographics | Rating | Rank | College, Under 1 year |
| Tsimshian | 17.9 /100 | #198 | Poor 64.3% |
| Panamanians | 17.0 /100 | #199 | Poor 64.3% |
| Nigerians | 16.7 /100 | #200 | Poor 64.3% |
| French Canadians | 16.3 /100 | #201 | Poor 64.2% |
| South Americans | 16.2 /100 | #202 | Poor 64.2% |
| Uruguayans | 15.6 /100 | #203 | Poor 64.2% |
| Immigrants | Zaire | 14.6 /100 | #204 | Poor 64.1% |
| Peruvians | 13.7 /100 | #205 | Poor 64.1% |
| Whites/Caucasians | 12.8 /100 | #206 | Poor 64.0% |
| Colombians | 12.4 /100 | #207 | Poor 64.0% |
| Immigrants | Vietnam | 12.1 /100 | #208 | Poor 64.0% |
| Puget Sound Salish | 11.3 /100 | #209 | Poor 63.9% |
| Ghanaians | 11.2 /100 | #210 | Poor 63.9% |
| Native Hawaiians | 10.6 /100 | #211 | Poor 63.9% |
| Immigrants | Middle Africa | 10.5 /100 | #212 | Poor 63.9% |