Immigrants from Kenya vs Syrian Currently Married
COMPARE
Immigrants from Kenya
Syrian
Currently Married
Currently Married Comparison
Immigrants from Kenya
Syrians
44.9%
CURRENTLY MARRIED
1.6/ 100
METRIC RATING
230th/ 347
METRIC RANK
47.5%
CURRENTLY MARRIED
88.9/ 100
METRIC RATING
120th/ 347
METRIC RANK
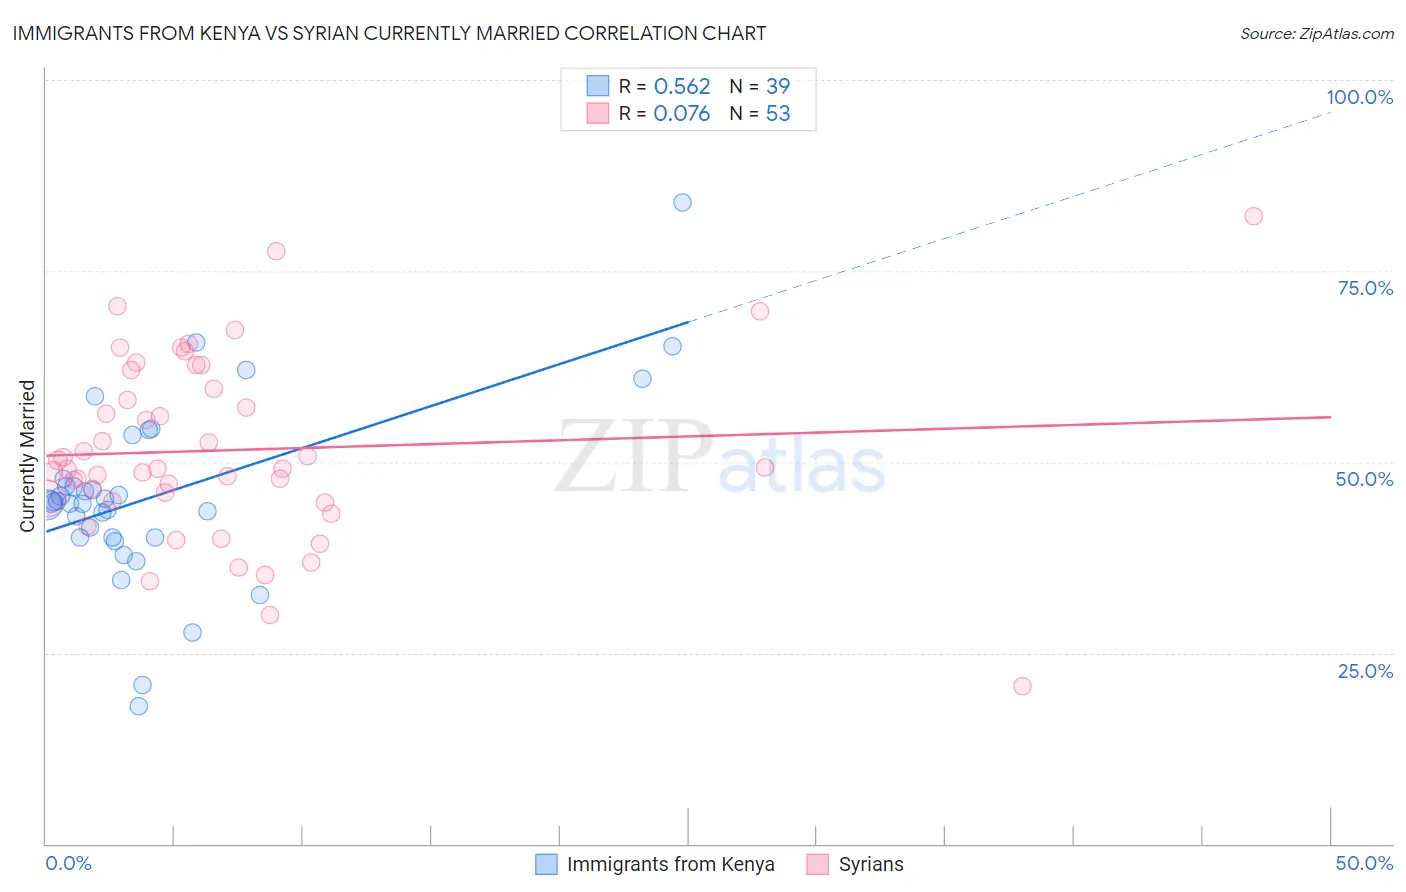
Immigrants from Kenya vs Syrian Currently Married Correlation Chart
The statistical analysis conducted on geographies consisting of 218,071,157 people shows a substantial positive correlation between the proportion of Immigrants from Kenya and percentage of population currently married in the United States with a correlation coefficient (R) of 0.562 and weighted average of 44.9%. Similarly, the statistical analysis conducted on geographies consisting of 266,298,061 people shows a slight positive correlation between the proportion of Syrians and percentage of population currently married in the United States with a correlation coefficient (R) of 0.076 and weighted average of 47.5%, a difference of 5.9%.
Currently Married Correlation Summary
| Measurement | Immigrants from Kenya | Syrian |
| Minimum | 18.0% | 20.6% |
| Maximum | 83.9% | 82.1% |
| Range | 65.9% | 61.5% |
| Mean | 45.6% | 51.6% |
| Median | 44.8% | 49.1% |
| Interquartile 25% (IQ1) | 40.1% | 45.0% |
| Interquartile 75% (IQ3) | 47.8% | 60.8% |
| Interquartile Range (IQR) | 7.8% | 15.7% |
| Standard Deviation (Sample) | 12.0% | 11.8% |
| Standard Deviation (Population) | 11.8% | 11.7% |
Similar Demographics by Currently Married
Demographics Similar to Immigrants from Kenya by Currently Married
In terms of currently married, the demographic groups most similar to Immigrants from Kenya are Cree (44.9%, a difference of 0.040%), Immigrants from Panama (44.9%, a difference of 0.040%), Immigrants from Uruguay (45.0%, a difference of 0.23%), Comanche (45.0%, a difference of 0.24%), and Spanish American (45.0%, a difference of 0.24%).
| Demographics | Rating | Rank | Currently Married |
| Immigrants | Laos | 2.3 /100 | #223 | Tragic 45.0% |
| Immigrants | Uganda | 2.2 /100 | #224 | Tragic 45.0% |
| French American Indians | 2.2 /100 | #225 | Tragic 45.0% |
| Comanche | 2.1 /100 | #226 | Tragic 45.0% |
| Spanish Americans | 2.1 /100 | #227 | Tragic 45.0% |
| Immigrants | Uruguay | 2.0 /100 | #228 | Tragic 45.0% |
| Cree | 1.7 /100 | #229 | Tragic 44.9% |
| Immigrants | Kenya | 1.6 /100 | #230 | Tragic 44.9% |
| Immigrants | Panama | 1.5 /100 | #231 | Tragic 44.9% |
| Nepalese | 1.2 /100 | #232 | Tragic 44.7% |
| Immigrants | Saudi Arabia | 1.1 /100 | #233 | Tragic 44.7% |
| Iroquois | 1.1 /100 | #234 | Tragic 44.7% |
| Alaskan Athabascans | 0.9 /100 | #235 | Tragic 44.6% |
| Cubans | 0.9 /100 | #236 | Tragic 44.6% |
| Seminole | 0.9 /100 | #237 | Tragic 44.6% |
Demographics Similar to Syrians by Currently Married
In terms of currently married, the demographic groups most similar to Syrians are Immigrants from Croatia (47.5%, a difference of 0.030%), Osage (47.5%, a difference of 0.090%), Immigrants from Philippines (47.6%, a difference of 0.12%), Australian (47.6%, a difference of 0.12%), and Puget Sound Salish (47.6%, a difference of 0.13%).
| Demographics | Rating | Rank | Currently Married |
| Immigrants | Denmark | 90.9 /100 | #113 | Exceptional 47.6% |
| South Africans | 90.5 /100 | #114 | Exceptional 47.6% |
| Immigrants | Indonesia | 90.5 /100 | #115 | Exceptional 47.6% |
| Palestinians | 90.4 /100 | #116 | Exceptional 47.6% |
| Puget Sound Salish | 90.3 /100 | #117 | Exceptional 47.6% |
| Immigrants | Philippines | 90.2 /100 | #118 | Exceptional 47.6% |
| Australians | 90.2 /100 | #119 | Exceptional 47.6% |
| Syrians | 88.9 /100 | #120 | Excellent 47.5% |
| Immigrants | Croatia | 88.6 /100 | #121 | Excellent 47.5% |
| Osage | 87.9 /100 | #122 | Excellent 47.5% |
| Immigrants | Kazakhstan | 87.2 /100 | #123 | Excellent 47.4% |
| Laotians | 86.6 /100 | #124 | Excellent 47.4% |
| Okinawans | 85.3 /100 | #125 | Excellent 47.4% |
| Immigrants | Jordan | 84.9 /100 | #126 | Excellent 47.4% |
| New Zealanders | 84.9 /100 | #127 | Excellent 47.4% |