Immigrants from Japan vs Lumbee GED/Equivalency
COMPARE
Immigrants from Japan
Lumbee
GED/Equivalency
GED/Equivalency Comparison
Immigrants from Japan
Lumbee
88.4%
GED/EQUIVALENCY
99.7/ 100
METRIC RATING
34th/ 347
METRIC RANK
80.0%
GED/EQUIVALENCY
0.0/ 100
METRIC RATING
322nd/ 347
METRIC RANK
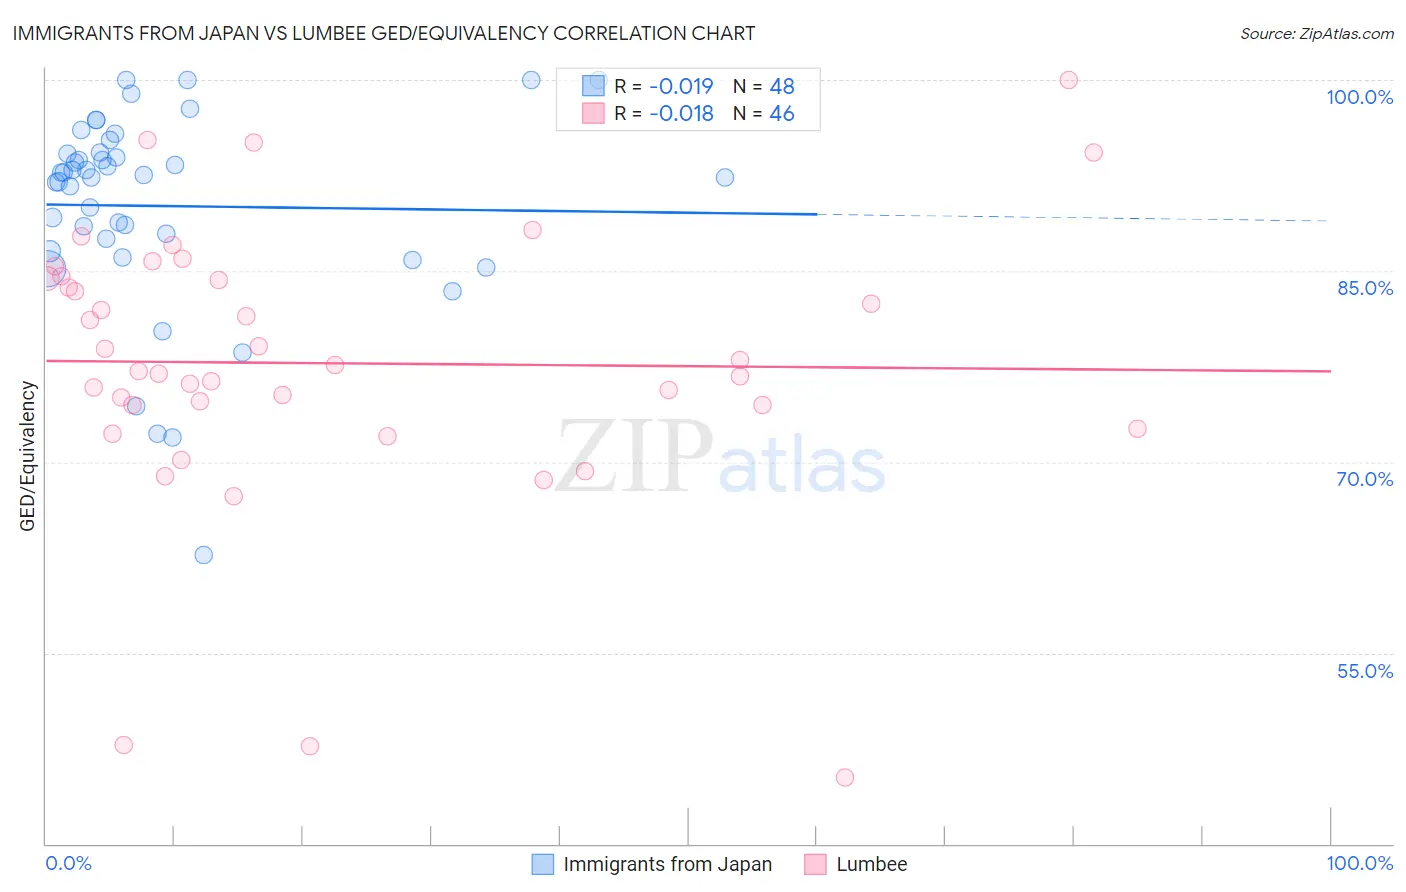
Immigrants from Japan vs Lumbee GED/Equivalency Correlation Chart
The statistical analysis conducted on geographies consisting of 340,148,851 people shows no correlation between the proportion of Immigrants from Japan and percentage of population with at least ged/equivalency education in the United States with a correlation coefficient (R) of -0.019 and weighted average of 88.4%. Similarly, the statistical analysis conducted on geographies consisting of 92,299,068 people shows no correlation between the proportion of Lumbee and percentage of population with at least ged/equivalency education in the United States with a correlation coefficient (R) of -0.018 and weighted average of 80.0%, a difference of 10.5%.
GED/Equivalency Correlation Summary
| Measurement | Immigrants from Japan | Lumbee |
| Minimum | 62.7% | 45.2% |
| Maximum | 100.0% | 100.0% |
| Range | 37.3% | 54.8% |
| Mean | 90.1% | 77.7% |
| Median | 92.4% | 77.4% |
| Interquartile 25% (IQ1) | 87.1% | 74.5% |
| Interquartile 75% (IQ3) | 94.3% | 84.4% |
| Interquartile Range (IQR) | 7.2% | 10.0% |
| Standard Deviation (Sample) | 7.9% | 11.1% |
| Standard Deviation (Population) | 7.8% | 11.0% |
Similar Demographics by GED/Equivalency
Demographics Similar to Immigrants from Japan by GED/Equivalency
In terms of ged/equivalency, the demographic groups most similar to Immigrants from Japan are Immigrants from Sweden (88.4%, a difference of 0.010%), Immigrants from South Central Asia (88.4%, a difference of 0.020%), Immigrants from Belgium (88.3%, a difference of 0.040%), Danish (88.4%, a difference of 0.050%), and Bhutanese (88.4%, a difference of 0.070%).
| Demographics | Rating | Rank | GED/Equivalency |
| Immigrants | Lithuania | 99.8 /100 | #27 | Exceptional 88.6% |
| Immigrants | Northern Europe | 99.8 /100 | #28 | Exceptional 88.5% |
| Poles | 99.8 /100 | #29 | Exceptional 88.5% |
| Turks | 99.8 /100 | #30 | Exceptional 88.5% |
| Bhutanese | 99.8 /100 | #31 | Exceptional 88.4% |
| Danes | 99.8 /100 | #32 | Exceptional 88.4% |
| Immigrants | Sweden | 99.7 /100 | #33 | Exceptional 88.4% |
| Immigrants | Japan | 99.7 /100 | #34 | Exceptional 88.4% |
| Immigrants | South Central Asia | 99.7 /100 | #35 | Exceptional 88.4% |
| Immigrants | Belgium | 99.7 /100 | #36 | Exceptional 88.3% |
| Immigrants | Austria | 99.7 /100 | #37 | Exceptional 88.3% |
| Burmese | 99.7 /100 | #38 | Exceptional 88.3% |
| Immigrants | Israel | 99.6 /100 | #39 | Exceptional 88.2% |
| Italians | 99.6 /100 | #40 | Exceptional 88.2% |
| Finns | 99.6 /100 | #41 | Exceptional 88.2% |
Demographics Similar to Lumbee by GED/Equivalency
In terms of ged/equivalency, the demographic groups most similar to Lumbee are Yup'ik (80.0%, a difference of 0.070%), Immigrants from Nicaragua (79.9%, a difference of 0.12%), Immigrants from Cuba (80.2%, a difference of 0.24%), Yaqui (80.5%, a difference of 0.65%), and Immigrants from Belize (80.5%, a difference of 0.65%).
| Demographics | Rating | Rank | GED/Equivalency |
| Apache | 0.0 /100 | #315 | Tragic 80.7% |
| Central American Indians | 0.0 /100 | #316 | Tragic 80.6% |
| Immigrants | Caribbean | 0.0 /100 | #317 | Tragic 80.5% |
| Yaqui | 0.0 /100 | #318 | Tragic 80.5% |
| Immigrants | Belize | 0.0 /100 | #319 | Tragic 80.5% |
| Immigrants | Cuba | 0.0 /100 | #320 | Tragic 80.2% |
| Yup'ik | 0.0 /100 | #321 | Tragic 80.0% |
| Lumbee | 0.0 /100 | #322 | Tragic 80.0% |
| Immigrants | Nicaragua | 0.0 /100 | #323 | Tragic 79.9% |
| Mexican American Indians | 0.0 /100 | #324 | Tragic 79.4% |
| Hondurans | 0.0 /100 | #325 | Tragic 79.3% |
| Yuman | 0.0 /100 | #326 | Tragic 79.2% |
| Central Americans | 0.0 /100 | #327 | Tragic 79.2% |
| Hispanics or Latinos | 0.0 /100 | #328 | Tragic 79.1% |
| Dominicans | 0.0 /100 | #329 | Tragic 79.1% |