Immigrants from Japan vs Scotch-Irish GED/Equivalency
COMPARE
Immigrants from Japan
Scotch-Irish
GED/Equivalency
GED/Equivalency Comparison
Immigrants from Japan
Scotch-Irish
88.4%
GED/EQUIVALENCY
99.7/ 100
METRIC RATING
34th/ 347
METRIC RANK
86.8%
GED/EQUIVALENCY
91.6/ 100
METRIC RATING
120th/ 347
METRIC RANK
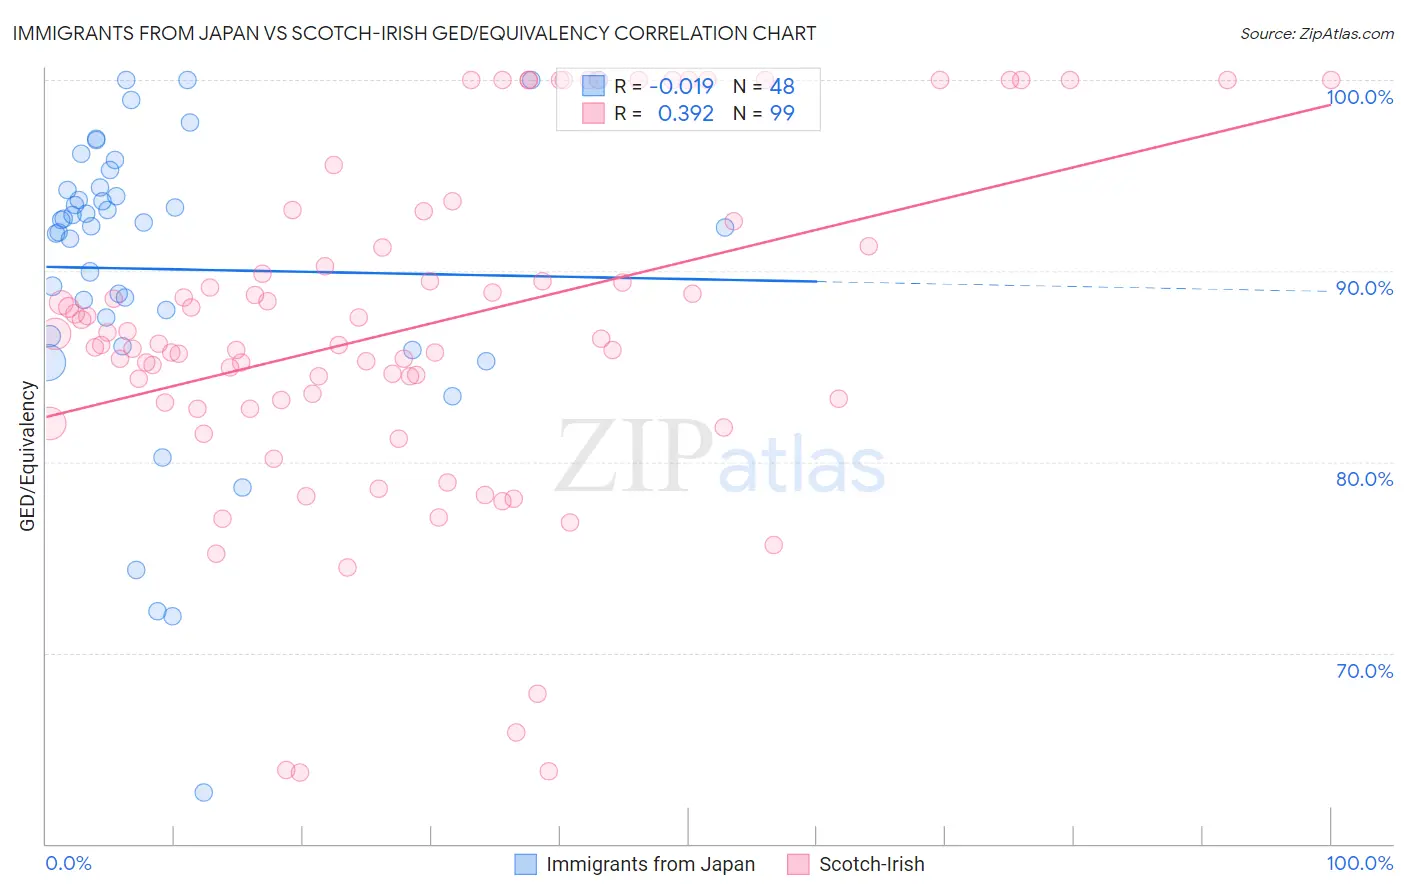
Immigrants from Japan vs Scotch-Irish GED/Equivalency Correlation Chart
The statistical analysis conducted on geographies consisting of 340,148,851 people shows no correlation between the proportion of Immigrants from Japan and percentage of population with at least ged/equivalency education in the United States with a correlation coefficient (R) of -0.019 and weighted average of 88.4%. Similarly, the statistical analysis conducted on geographies consisting of 548,780,564 people shows a mild positive correlation between the proportion of Scotch-Irish and percentage of population with at least ged/equivalency education in the United States with a correlation coefficient (R) of 0.392 and weighted average of 86.8%, a difference of 1.8%.
GED/Equivalency Correlation Summary
| Measurement | Immigrants from Japan | Scotch-Irish |
| Minimum | 62.7% | 63.7% |
| Maximum | 100.0% | 100.0% |
| Range | 37.3% | 36.3% |
| Mean | 90.1% | 87.0% |
| Median | 92.4% | 86.2% |
| Interquartile 25% (IQ1) | 87.1% | 83.1% |
| Interquartile 75% (IQ3) | 94.3% | 91.3% |
| Interquartile Range (IQR) | 7.2% | 8.2% |
| Standard Deviation (Sample) | 7.9% | 8.7% |
| Standard Deviation (Population) | 7.8% | 8.7% |
Similar Demographics by GED/Equivalency
Demographics Similar to Immigrants from Japan by GED/Equivalency
In terms of ged/equivalency, the demographic groups most similar to Immigrants from Japan are Immigrants from Sweden (88.4%, a difference of 0.010%), Immigrants from South Central Asia (88.4%, a difference of 0.020%), Immigrants from Belgium (88.3%, a difference of 0.040%), Danish (88.4%, a difference of 0.050%), and Bhutanese (88.4%, a difference of 0.070%).
| Demographics | Rating | Rank | GED/Equivalency |
| Immigrants | Lithuania | 99.8 /100 | #27 | Exceptional 88.6% |
| Immigrants | Northern Europe | 99.8 /100 | #28 | Exceptional 88.5% |
| Poles | 99.8 /100 | #29 | Exceptional 88.5% |
| Turks | 99.8 /100 | #30 | Exceptional 88.5% |
| Bhutanese | 99.8 /100 | #31 | Exceptional 88.4% |
| Danes | 99.8 /100 | #32 | Exceptional 88.4% |
| Immigrants | Sweden | 99.7 /100 | #33 | Exceptional 88.4% |
| Immigrants | Japan | 99.7 /100 | #34 | Exceptional 88.4% |
| Immigrants | South Central Asia | 99.7 /100 | #35 | Exceptional 88.4% |
| Immigrants | Belgium | 99.7 /100 | #36 | Exceptional 88.3% |
| Immigrants | Austria | 99.7 /100 | #37 | Exceptional 88.3% |
| Burmese | 99.7 /100 | #38 | Exceptional 88.3% |
| Immigrants | Israel | 99.6 /100 | #39 | Exceptional 88.2% |
| Italians | 99.6 /100 | #40 | Exceptional 88.2% |
| Finns | 99.6 /100 | #41 | Exceptional 88.2% |
Demographics Similar to Scotch-Irish by GED/Equivalency
In terms of ged/equivalency, the demographic groups most similar to Scotch-Irish are Immigrants from Lebanon (86.8%, a difference of 0.050%), Immigrants from Jordan (86.8%, a difference of 0.050%), Immigrants from Italy (86.7%, a difference of 0.070%), Immigrants from Egypt (86.7%, a difference of 0.080%), and Celtic (86.7%, a difference of 0.080%).
| Demographics | Rating | Rank | GED/Equivalency |
| Assyrians/Chaldeans/Syriacs | 94.8 /100 | #113 | Exceptional 87.0% |
| Immigrants | Kazakhstan | 94.7 /100 | #114 | Exceptional 87.0% |
| Mongolians | 94.6 /100 | #115 | Exceptional 87.0% |
| Swiss | 94.5 /100 | #116 | Exceptional 87.0% |
| Immigrants | Hong Kong | 93.8 /100 | #117 | Exceptional 86.9% |
| French Canadians | 93.2 /100 | #118 | Exceptional 86.9% |
| Immigrants | China | 93.2 /100 | #119 | Exceptional 86.9% |
| Scotch-Irish | 91.6 /100 | #120 | Exceptional 86.8% |
| Immigrants | Lebanon | 90.9 /100 | #121 | Exceptional 86.8% |
| Immigrants | Jordan | 90.8 /100 | #122 | Exceptional 86.8% |
| Immigrants | Italy | 90.5 /100 | #123 | Exceptional 86.7% |
| Immigrants | Egypt | 90.4 /100 | #124 | Exceptional 86.7% |
| Celtics | 90.4 /100 | #125 | Exceptional 86.7% |
| Asians | 90.3 /100 | #126 | Exceptional 86.7% |
| Argentineans | 89.7 /100 | #127 | Excellent 86.7% |