Immigrants from Israel vs Nonimmigrants GED/Equivalency
COMPARE
Immigrants from Israel
Nonimmigrants
GED/Equivalency
GED/Equivalency Comparison
Immigrants from Israel
Nonimmigrants
88.2%
GED/EQUIVALENCY
99.6/ 100
METRIC RATING
39th/ 347
METRIC RANK
85.2%
GED/EQUIVALENCY
22.7/ 100
METRIC RATING
192nd/ 347
METRIC RANK
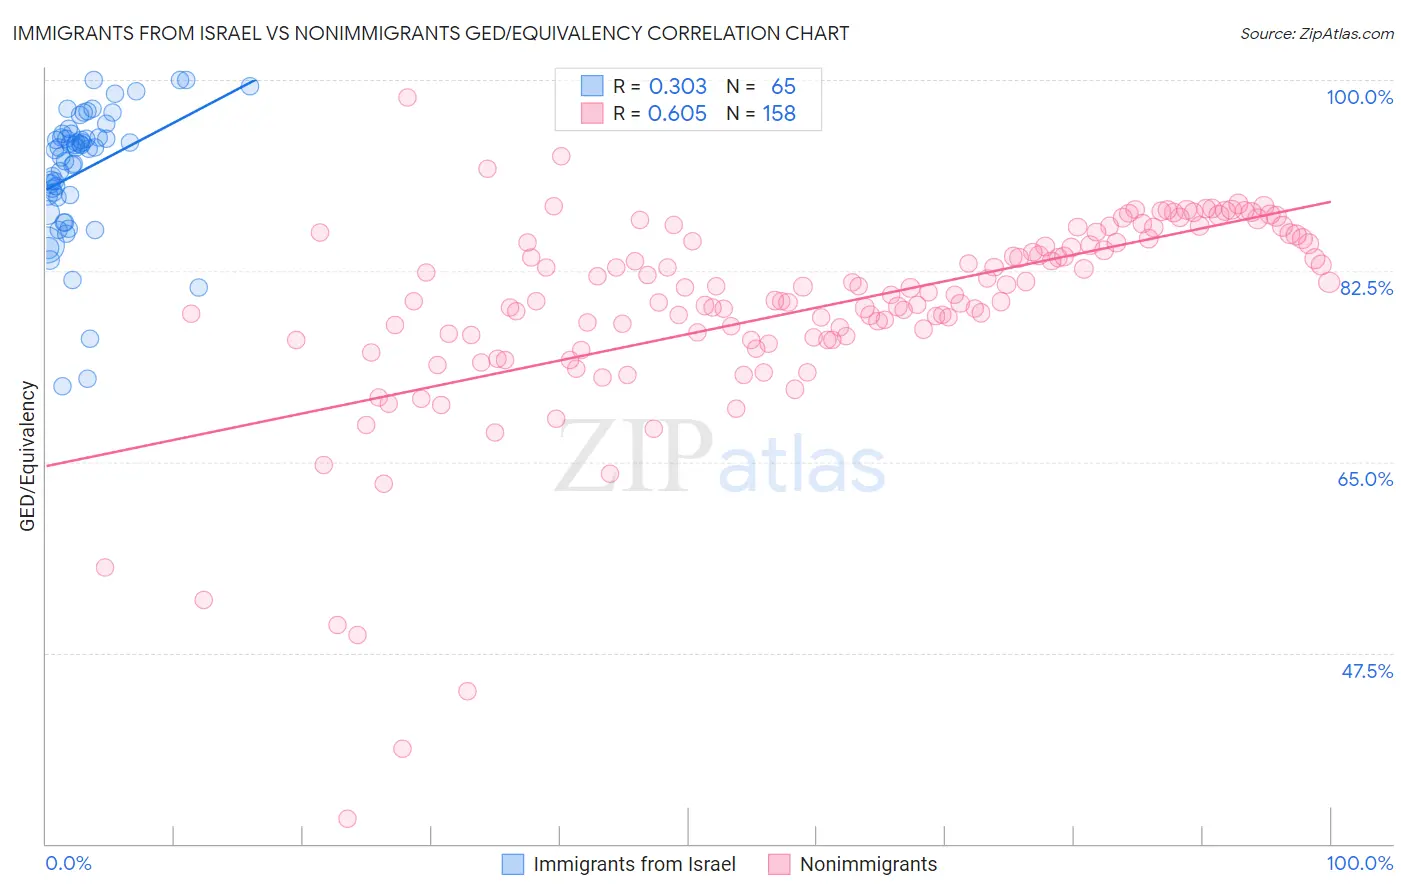
Immigrants from Israel vs Nonimmigrants GED/Equivalency Correlation Chart
The statistical analysis conducted on geographies consisting of 210,029,020 people shows a mild positive correlation between the proportion of Immigrants from Israel and percentage of population with at least ged/equivalency education in the United States with a correlation coefficient (R) of 0.303 and weighted average of 88.2%. Similarly, the statistical analysis conducted on geographies consisting of 585,366,948 people shows a significant positive correlation between the proportion of Nonimmigrants and percentage of population with at least ged/equivalency education in the United States with a correlation coefficient (R) of 0.605 and weighted average of 85.2%, a difference of 3.5%.
GED/Equivalency Correlation Summary
| Measurement | Immigrants from Israel | Nonimmigrants |
| Minimum | 72.0% | 32.3% |
| Maximum | 100.0% | 98.4% |
| Range | 28.0% | 66.2% |
| Mean | 91.7% | 79.2% |
| Median | 93.8% | 80.3% |
| Interquartile 25% (IQ1) | 89.3% | 76.4% |
| Interquartile 75% (IQ3) | 94.9% | 85.3% |
| Interquartile Range (IQR) | 5.6% | 8.8% |
| Standard Deviation (Sample) | 6.0% | 9.4% |
| Standard Deviation (Population) | 6.0% | 9.4% |
Similar Demographics by GED/Equivalency
Demographics Similar to Immigrants from Israel by GED/Equivalency
In terms of ged/equivalency, the demographic groups most similar to Immigrants from Israel are Italian (88.2%, a difference of 0.020%), Finnish (88.2%, a difference of 0.030%), Cambodian (88.2%, a difference of 0.060%), Immigrants from Scotland (88.2%, a difference of 0.070%), and Burmese (88.3%, a difference of 0.090%).
| Demographics | Rating | Rank | GED/Equivalency |
| Danes | 99.8 /100 | #32 | Exceptional 88.4% |
| Immigrants | Sweden | 99.7 /100 | #33 | Exceptional 88.4% |
| Immigrants | Japan | 99.7 /100 | #34 | Exceptional 88.4% |
| Immigrants | South Central Asia | 99.7 /100 | #35 | Exceptional 88.4% |
| Immigrants | Belgium | 99.7 /100 | #36 | Exceptional 88.3% |
| Immigrants | Austria | 99.7 /100 | #37 | Exceptional 88.3% |
| Burmese | 99.7 /100 | #38 | Exceptional 88.3% |
| Immigrants | Israel | 99.6 /100 | #39 | Exceptional 88.2% |
| Italians | 99.6 /100 | #40 | Exceptional 88.2% |
| Finns | 99.6 /100 | #41 | Exceptional 88.2% |
| Cambodians | 99.6 /100 | #42 | Exceptional 88.2% |
| Immigrants | Scotland | 99.6 /100 | #43 | Exceptional 88.2% |
| Macedonians | 99.5 /100 | #44 | Exceptional 88.1% |
| Czechs | 99.5 /100 | #45 | Exceptional 88.1% |
| Immigrants | Switzerland | 99.5 /100 | #46 | Exceptional 88.1% |
Demographics Similar to Nonimmigrants by GED/Equivalency
In terms of ged/equivalency, the demographic groups most similar to Nonimmigrants are South American Indian (85.2%, a difference of 0.0%), Delaware (85.2%, a difference of 0.010%), Puget Sound Salish (85.2%, a difference of 0.060%), Chippewa (85.2%, a difference of 0.060%), and Tongan (85.2%, a difference of 0.060%).
| Demographics | Rating | Rank | GED/Equivalency |
| Spanish | 32.8 /100 | #185 | Fair 85.4% |
| Spaniards | 31.9 /100 | #186 | Fair 85.4% |
| Immigrants | Afghanistan | 29.8 /100 | #187 | Fair 85.4% |
| Immigrants | Sierra Leone | 29.0 /100 | #188 | Fair 85.4% |
| Guamanians/Chamorros | 28.4 /100 | #189 | Fair 85.3% |
| Alaskan Athabascans | 27.5 /100 | #190 | Fair 85.3% |
| South American Indians | 22.8 /100 | #191 | Fair 85.2% |
| Immigrants | Nonimmigrants | 22.7 /100 | #192 | Fair 85.2% |
| Delaware | 22.2 /100 | #193 | Fair 85.2% |
| Puget Sound Salish | 20.8 /100 | #194 | Fair 85.2% |
| Chippewa | 20.8 /100 | #195 | Fair 85.2% |
| Tongans | 20.7 /100 | #196 | Fair 85.2% |
| Costa Ricans | 20.4 /100 | #197 | Fair 85.2% |
| Immigrants | Africa | 17.5 /100 | #198 | Poor 85.1% |
| Somalis | 16.4 /100 | #199 | Poor 85.0% |