Honduran vs Nonimmigrants GED/Equivalency
COMPARE
Honduran
Nonimmigrants
GED/Equivalency
GED/Equivalency Comparison
Hondurans
Nonimmigrants
79.3%
GED/EQUIVALENCY
0.0/ 100
METRIC RATING
325th/ 347
METRIC RANK
85.2%
GED/EQUIVALENCY
22.7/ 100
METRIC RATING
192nd/ 347
METRIC RANK
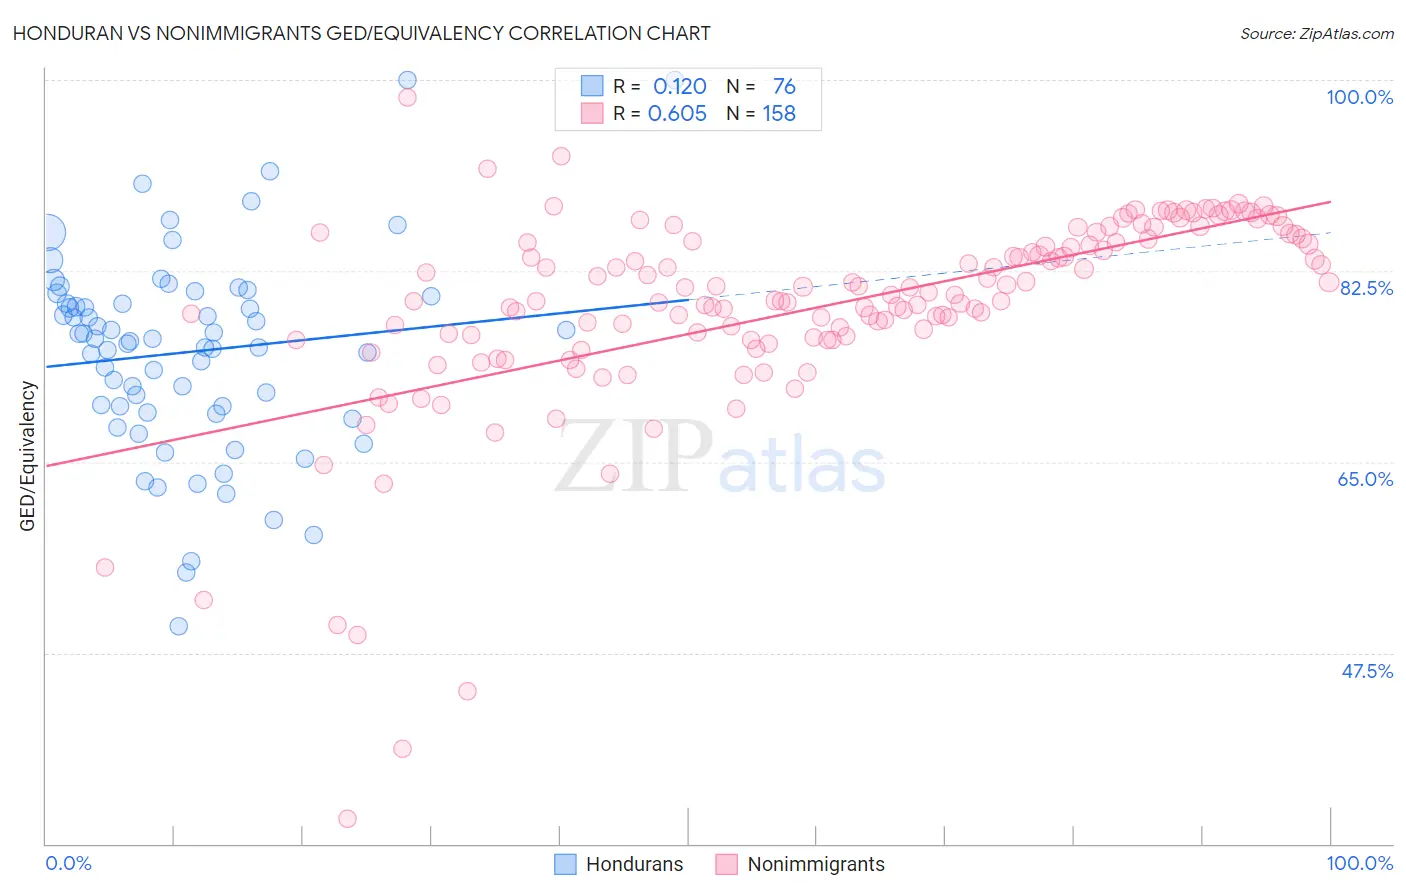
Honduran vs Nonimmigrants GED/Equivalency Correlation Chart
The statistical analysis conducted on geographies consisting of 357,858,578 people shows a poor positive correlation between the proportion of Hondurans and percentage of population with at least ged/equivalency education in the United States with a correlation coefficient (R) of 0.120 and weighted average of 79.3%. Similarly, the statistical analysis conducted on geographies consisting of 585,366,948 people shows a significant positive correlation between the proportion of Nonimmigrants and percentage of population with at least ged/equivalency education in the United States with a correlation coefficient (R) of 0.605 and weighted average of 85.2%, a difference of 7.5%.
GED/Equivalency Correlation Summary
| Measurement | Honduran | Nonimmigrants |
| Minimum | 50.0% | 32.3% |
| Maximum | 100.0% | 98.4% |
| Range | 50.0% | 66.2% |
| Mean | 75.1% | 79.2% |
| Median | 76.2% | 80.3% |
| Interquartile 25% (IQ1) | 69.8% | 76.4% |
| Interquartile 75% (IQ3) | 79.8% | 85.3% |
| Interquartile Range (IQR) | 10.1% | 8.8% |
| Standard Deviation (Sample) | 9.2% | 9.4% |
| Standard Deviation (Population) | 9.1% | 9.4% |
Similar Demographics by GED/Equivalency
Demographics Similar to Hondurans by GED/Equivalency
In terms of ged/equivalency, the demographic groups most similar to Hondurans are Yuman (79.2%, a difference of 0.090%), Central American (79.2%, a difference of 0.11%), Mexican American Indian (79.4%, a difference of 0.12%), Hispanic or Latino (79.1%, a difference of 0.22%), and Dominican (79.1%, a difference of 0.27%).
| Demographics | Rating | Rank | GED/Equivalency |
| Yaqui | 0.0 /100 | #318 | Tragic 80.5% |
| Immigrants | Belize | 0.0 /100 | #319 | Tragic 80.5% |
| Immigrants | Cuba | 0.0 /100 | #320 | Tragic 80.2% |
| Yup'ik | 0.0 /100 | #321 | Tragic 80.0% |
| Lumbee | 0.0 /100 | #322 | Tragic 80.0% |
| Immigrants | Nicaragua | 0.0 /100 | #323 | Tragic 79.9% |
| Mexican American Indians | 0.0 /100 | #324 | Tragic 79.4% |
| Hondurans | 0.0 /100 | #325 | Tragic 79.3% |
| Yuman | 0.0 /100 | #326 | Tragic 79.2% |
| Central Americans | 0.0 /100 | #327 | Tragic 79.2% |
| Hispanics or Latinos | 0.0 /100 | #328 | Tragic 79.1% |
| Dominicans | 0.0 /100 | #329 | Tragic 79.1% |
| Immigrants | Cabo Verde | 0.0 /100 | #330 | Tragic 78.9% |
| Immigrants | Honduras | 0.0 /100 | #331 | Tragic 78.7% |
| Immigrants | Azores | 0.0 /100 | #332 | Tragic 78.7% |
Demographics Similar to Nonimmigrants by GED/Equivalency
In terms of ged/equivalency, the demographic groups most similar to Nonimmigrants are South American Indian (85.2%, a difference of 0.0%), Delaware (85.2%, a difference of 0.010%), Puget Sound Salish (85.2%, a difference of 0.060%), Chippewa (85.2%, a difference of 0.060%), and Tongan (85.2%, a difference of 0.060%).
| Demographics | Rating | Rank | GED/Equivalency |
| Spanish | 32.8 /100 | #185 | Fair 85.4% |
| Spaniards | 31.9 /100 | #186 | Fair 85.4% |
| Immigrants | Afghanistan | 29.8 /100 | #187 | Fair 85.4% |
| Immigrants | Sierra Leone | 29.0 /100 | #188 | Fair 85.4% |
| Guamanians/Chamorros | 28.4 /100 | #189 | Fair 85.3% |
| Alaskan Athabascans | 27.5 /100 | #190 | Fair 85.3% |
| South American Indians | 22.8 /100 | #191 | Fair 85.2% |
| Immigrants | Nonimmigrants | 22.7 /100 | #192 | Fair 85.2% |
| Delaware | 22.2 /100 | #193 | Fair 85.2% |
| Puget Sound Salish | 20.8 /100 | #194 | Fair 85.2% |
| Chippewa | 20.8 /100 | #195 | Fair 85.2% |
| Tongans | 20.7 /100 | #196 | Fair 85.2% |
| Costa Ricans | 20.4 /100 | #197 | Fair 85.2% |
| Immigrants | Africa | 17.5 /100 | #198 | Poor 85.1% |
| Somalis | 16.4 /100 | #199 | Poor 85.0% |