German vs Nonimmigrants GED/Equivalency
COMPARE
German
Nonimmigrants
GED/Equivalency
GED/Equivalency Comparison
Germans
Nonimmigrants
87.9%
GED/EQUIVALENCY
99.3/ 100
METRIC RATING
62nd/ 347
METRIC RANK
85.2%
GED/EQUIVALENCY
22.7/ 100
METRIC RATING
192nd/ 347
METRIC RANK
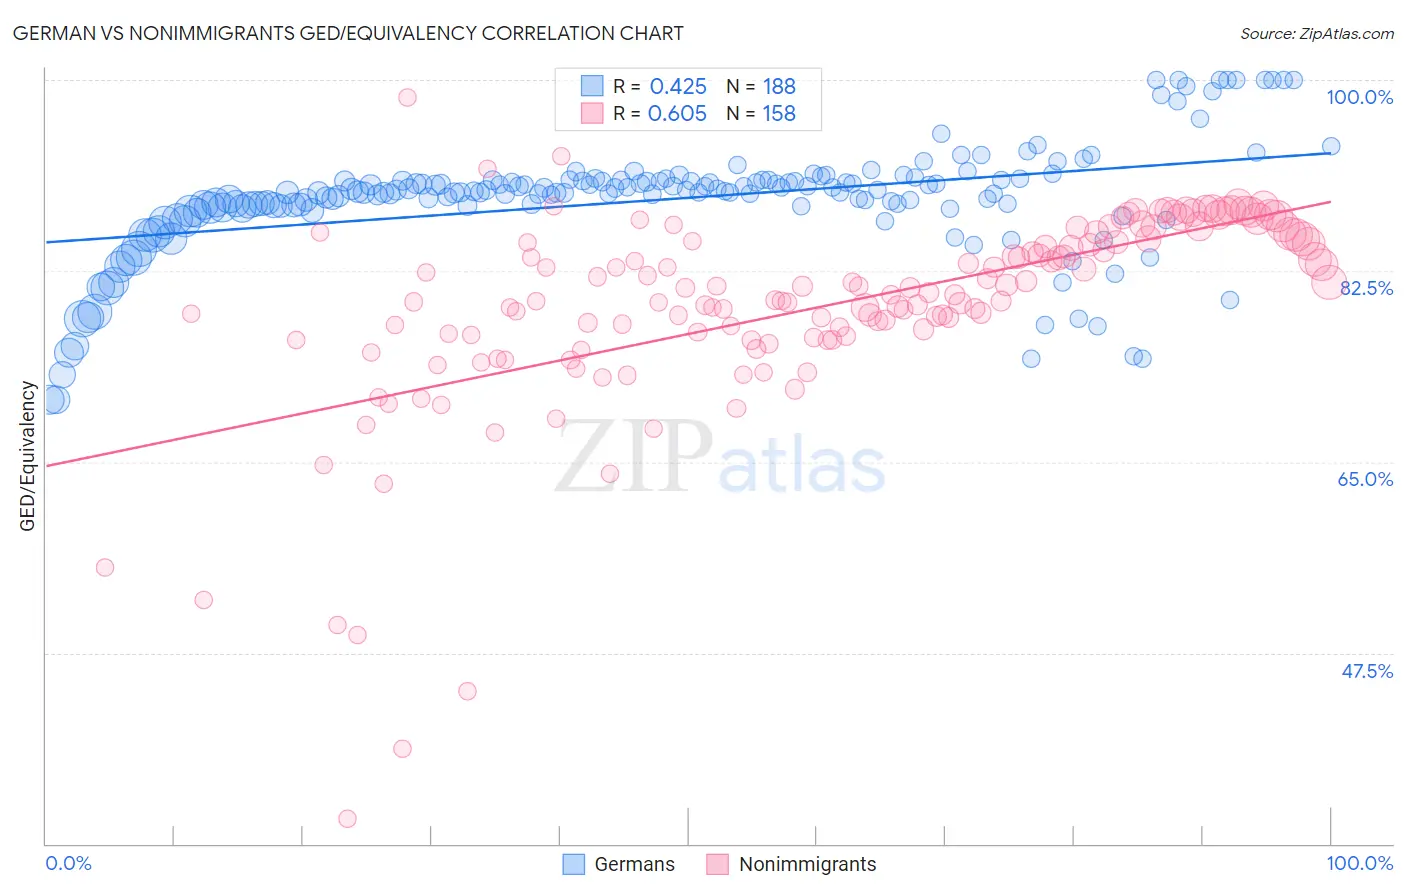
German vs Nonimmigrants GED/Equivalency Correlation Chart
The statistical analysis conducted on geographies consisting of 581,300,690 people shows a moderate positive correlation between the proportion of Germans and percentage of population with at least ged/equivalency education in the United States with a correlation coefficient (R) of 0.425 and weighted average of 87.9%. Similarly, the statistical analysis conducted on geographies consisting of 585,366,948 people shows a significant positive correlation between the proportion of Nonimmigrants and percentage of population with at least ged/equivalency education in the United States with a correlation coefficient (R) of 0.605 and weighted average of 85.2%, a difference of 3.2%.
GED/Equivalency Correlation Summary
| Measurement | German | Nonimmigrants |
| Minimum | 70.7% | 32.3% |
| Maximum | 100.0% | 98.4% |
| Range | 29.3% | 66.2% |
| Mean | 89.0% | 79.2% |
| Median | 89.7% | 80.3% |
| Interquartile 25% (IQ1) | 88.4% | 76.4% |
| Interquartile 75% (IQ3) | 90.8% | 85.3% |
| Interquartile Range (IQR) | 2.4% | 8.8% |
| Standard Deviation (Sample) | 5.3% | 9.4% |
| Standard Deviation (Population) | 5.3% | 9.4% |
Similar Demographics by GED/Equivalency
Demographics Similar to Germans by GED/Equivalency
In terms of ged/equivalency, the demographic groups most similar to Germans are Immigrants from Turkey (87.9%, a difference of 0.010%), Scandinavian (87.9%, a difference of 0.020%), European (87.9%, a difference of 0.020%), Serbian (87.9%, a difference of 0.030%), and Immigrants from Czechoslovakia (87.9%, a difference of 0.040%).
| Demographics | Rating | Rank | GED/Equivalency |
| New Zealanders | 99.4 /100 | #55 | Exceptional 88.0% |
| Immigrants | Denmark | 99.4 /100 | #56 | Exceptional 88.0% |
| Immigrants | Czechoslovakia | 99.3 /100 | #57 | Exceptional 87.9% |
| Northern Europeans | 99.3 /100 | #58 | Exceptional 87.9% |
| Serbians | 99.3 /100 | #59 | Exceptional 87.9% |
| Scandinavians | 99.3 /100 | #60 | Exceptional 87.9% |
| Europeans | 99.3 /100 | #61 | Exceptional 87.9% |
| Germans | 99.3 /100 | #62 | Exceptional 87.9% |
| Immigrants | Turkey | 99.2 /100 | #63 | Exceptional 87.9% |
| Immigrants | Canada | 99.2 /100 | #64 | Exceptional 87.9% |
| Immigrants | North America | 99.1 /100 | #65 | Exceptional 87.8% |
| Immigrants | Bulgaria | 99.1 /100 | #66 | Exceptional 87.8% |
| British | 99.1 /100 | #67 | Exceptional 87.8% |
| Immigrants | France | 99.1 /100 | #68 | Exceptional 87.8% |
| Immigrants | Saudi Arabia | 99.0 /100 | #69 | Exceptional 87.8% |
Demographics Similar to Nonimmigrants by GED/Equivalency
In terms of ged/equivalency, the demographic groups most similar to Nonimmigrants are South American Indian (85.2%, a difference of 0.0%), Delaware (85.2%, a difference of 0.010%), Puget Sound Salish (85.2%, a difference of 0.060%), Chippewa (85.2%, a difference of 0.060%), and Tongan (85.2%, a difference of 0.060%).
| Demographics | Rating | Rank | GED/Equivalency |
| Spanish | 32.8 /100 | #185 | Fair 85.4% |
| Spaniards | 31.9 /100 | #186 | Fair 85.4% |
| Immigrants | Afghanistan | 29.8 /100 | #187 | Fair 85.4% |
| Immigrants | Sierra Leone | 29.0 /100 | #188 | Fair 85.4% |
| Guamanians/Chamorros | 28.4 /100 | #189 | Fair 85.3% |
| Alaskan Athabascans | 27.5 /100 | #190 | Fair 85.3% |
| South American Indians | 22.8 /100 | #191 | Fair 85.2% |
| Immigrants | Nonimmigrants | 22.7 /100 | #192 | Fair 85.2% |
| Delaware | 22.2 /100 | #193 | Fair 85.2% |
| Puget Sound Salish | 20.8 /100 | #194 | Fair 85.2% |
| Chippewa | 20.8 /100 | #195 | Fair 85.2% |
| Tongans | 20.7 /100 | #196 | Fair 85.2% |
| Costa Ricans | 20.4 /100 | #197 | Fair 85.2% |
| Immigrants | Africa | 17.5 /100 | #198 | Poor 85.1% |
| Somalis | 16.4 /100 | #199 | Poor 85.0% |