Latvian vs Nonimmigrants GED/Equivalency
COMPARE
Latvian
Nonimmigrants
GED/Equivalency
GED/Equivalency Comparison
Latvians
Nonimmigrants
89.2%
GED/EQUIVALENCY
100.0/ 100
METRIC RATING
5th/ 347
METRIC RANK
85.2%
GED/EQUIVALENCY
22.7/ 100
METRIC RATING
192nd/ 347
METRIC RANK
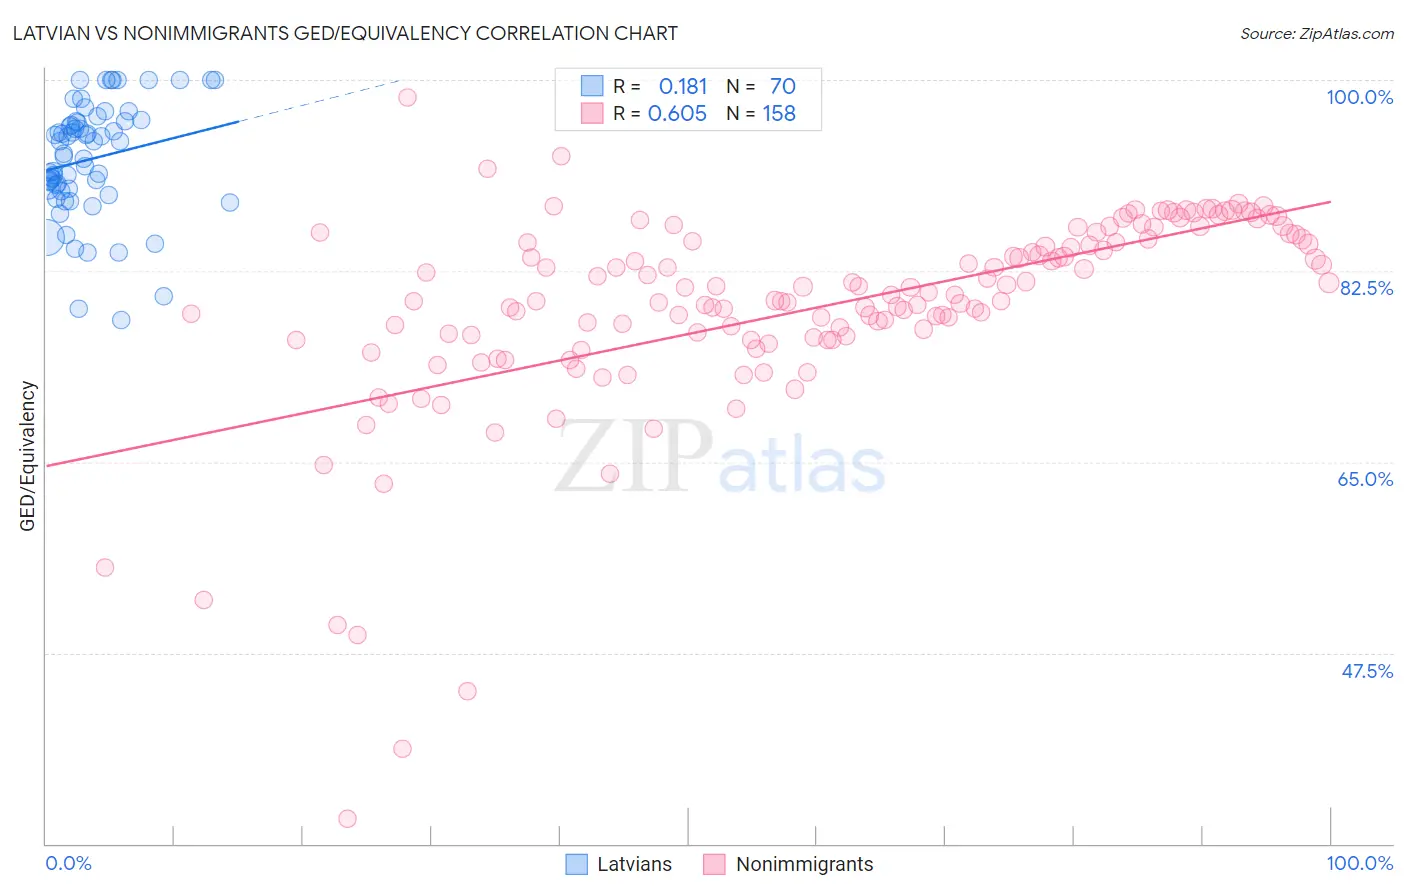
Latvian vs Nonimmigrants GED/Equivalency Correlation Chart
The statistical analysis conducted on geographies consisting of 220,726,693 people shows a poor positive correlation between the proportion of Latvians and percentage of population with at least ged/equivalency education in the United States with a correlation coefficient (R) of 0.181 and weighted average of 89.2%. Similarly, the statistical analysis conducted on geographies consisting of 585,366,948 people shows a significant positive correlation between the proportion of Nonimmigrants and percentage of population with at least ged/equivalency education in the United States with a correlation coefficient (R) of 0.605 and weighted average of 85.2%, a difference of 4.6%.
GED/Equivalency Correlation Summary
| Measurement | Latvian | Nonimmigrants |
| Minimum | 78.0% | 32.3% |
| Maximum | 100.0% | 98.4% |
| Range | 22.0% | 66.2% |
| Mean | 92.8% | 79.2% |
| Median | 93.8% | 80.3% |
| Interquartile 25% (IQ1) | 90.0% | 76.4% |
| Interquartile 75% (IQ3) | 96.2% | 85.3% |
| Interquartile Range (IQR) | 6.2% | 8.8% |
| Standard Deviation (Sample) | 5.2% | 9.4% |
| Standard Deviation (Population) | 5.2% | 9.4% |
Similar Demographics by GED/Equivalency
Demographics Similar to Latvians by GED/Equivalency
In terms of ged/equivalency, the demographic groups most similar to Latvians are Thai (89.1%, a difference of 0.020%), Eastern European (89.1%, a difference of 0.060%), Iranian (89.2%, a difference of 0.10%), Carpatho Rusyn (89.1%, a difference of 0.11%), and Chinese (89.0%, a difference of 0.13%).
| Demographics | Rating | Rank | GED/Equivalency |
| Immigrants | India | 100.0 /100 | #1 | Exceptional 89.7% |
| Filipinos | 100.0 /100 | #2 | Exceptional 89.5% |
| Immigrants | Singapore | 100.0 /100 | #3 | Exceptional 89.3% |
| Iranians | 100.0 /100 | #4 | Exceptional 89.2% |
| Latvians | 100.0 /100 | #5 | Exceptional 89.2% |
| Thais | 100.0 /100 | #6 | Exceptional 89.1% |
| Eastern Europeans | 99.9 /100 | #7 | Exceptional 89.1% |
| Carpatho Rusyns | 99.9 /100 | #8 | Exceptional 89.1% |
| Chinese | 99.9 /100 | #9 | Exceptional 89.0% |
| Norwegians | 99.9 /100 | #10 | Exceptional 89.0% |
| Bulgarians | 99.9 /100 | #11 | Exceptional 89.0% |
| Lithuanians | 99.9 /100 | #12 | Exceptional 88.9% |
| Immigrants | Iran | 99.9 /100 | #13 | Exceptional 88.9% |
| Cypriots | 99.9 /100 | #14 | Exceptional 88.9% |
| Okinawans | 99.9 /100 | #15 | Exceptional 88.9% |
Demographics Similar to Nonimmigrants by GED/Equivalency
In terms of ged/equivalency, the demographic groups most similar to Nonimmigrants are South American Indian (85.2%, a difference of 0.0%), Delaware (85.2%, a difference of 0.010%), Puget Sound Salish (85.2%, a difference of 0.060%), Chippewa (85.2%, a difference of 0.060%), and Tongan (85.2%, a difference of 0.060%).
| Demographics | Rating | Rank | GED/Equivalency |
| Spanish | 32.8 /100 | #185 | Fair 85.4% |
| Spaniards | 31.9 /100 | #186 | Fair 85.4% |
| Immigrants | Afghanistan | 29.8 /100 | #187 | Fair 85.4% |
| Immigrants | Sierra Leone | 29.0 /100 | #188 | Fair 85.4% |
| Guamanians/Chamorros | 28.4 /100 | #189 | Fair 85.3% |
| Alaskan Athabascans | 27.5 /100 | #190 | Fair 85.3% |
| South American Indians | 22.8 /100 | #191 | Fair 85.2% |
| Immigrants | Nonimmigrants | 22.7 /100 | #192 | Fair 85.2% |
| Delaware | 22.2 /100 | #193 | Fair 85.2% |
| Puget Sound Salish | 20.8 /100 | #194 | Fair 85.2% |
| Chippewa | 20.8 /100 | #195 | Fair 85.2% |
| Tongans | 20.7 /100 | #196 | Fair 85.2% |
| Costa Ricans | 20.4 /100 | #197 | Fair 85.2% |
| Immigrants | Africa | 17.5 /100 | #198 | Poor 85.1% |
| Somalis | 16.4 /100 | #199 | Poor 85.0% |