Immigrants from Denmark vs Inupiat Associate's Degree
COMPARE
Immigrants from Denmark
Inupiat
Associate's Degree
Associate's Degree Comparison
Immigrants from Denmark
Inupiat
53.1%
ASSOCIATE'S DEGREE
100.0/ 100
METRIC RATING
37th/ 347
METRIC RANK
32.6%
ASSOCIATE'S DEGREE
0.0/ 100
METRIC RATING
341st/ 347
METRIC RANK
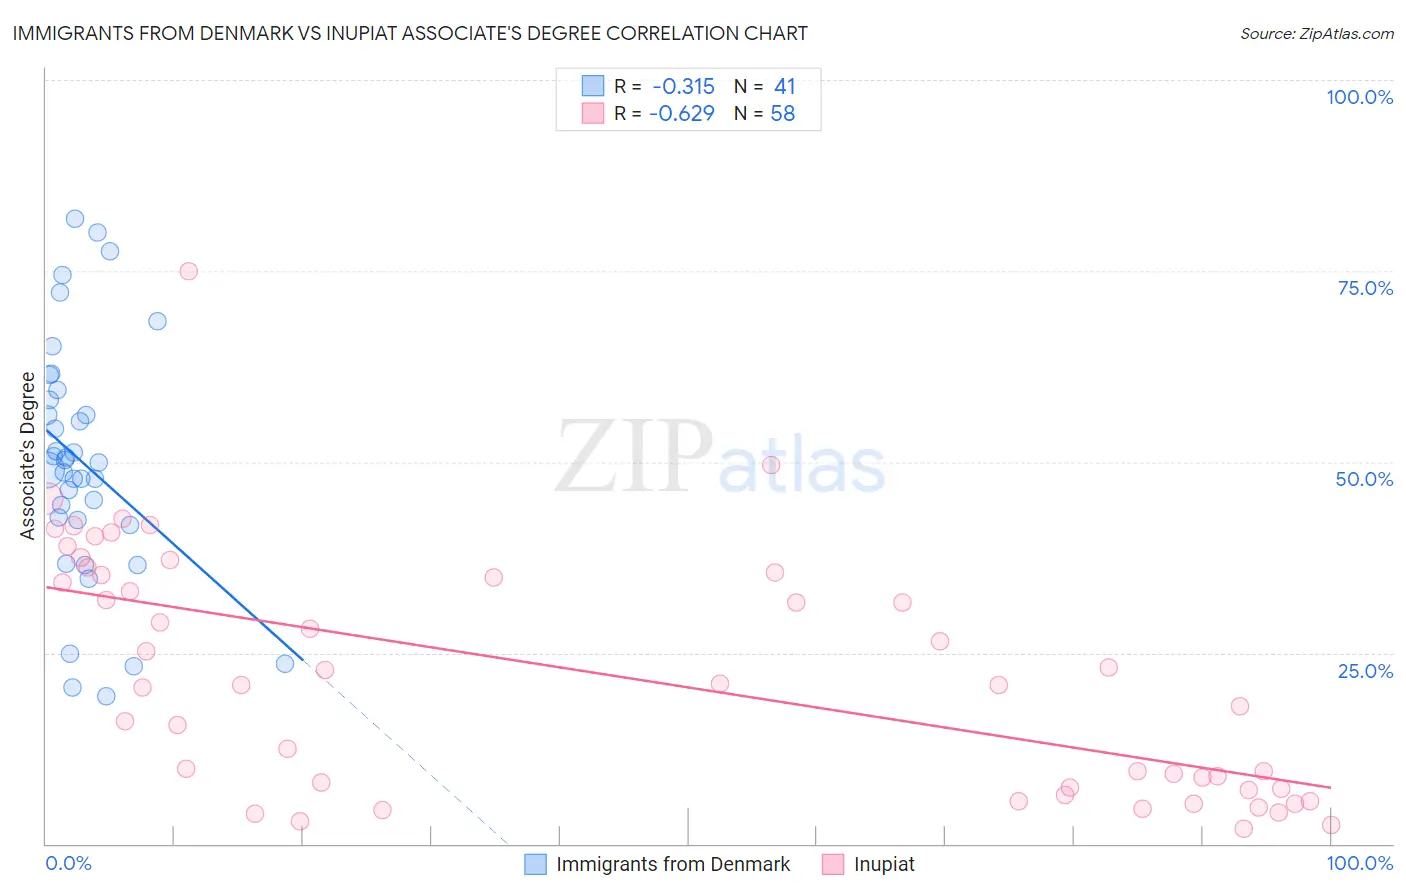
Immigrants from Denmark vs Inupiat Associate's Degree Correlation Chart
The statistical analysis conducted on geographies consisting of 136,428,731 people shows a mild negative correlation between the proportion of Immigrants from Denmark and percentage of population with at least associate's degree education in the United States with a correlation coefficient (R) of -0.315 and weighted average of 53.1%. Similarly, the statistical analysis conducted on geographies consisting of 96,347,955 people shows a significant negative correlation between the proportion of Inupiat and percentage of population with at least associate's degree education in the United States with a correlation coefficient (R) of -0.629 and weighted average of 32.6%, a difference of 62.9%.
Associate's Degree Correlation Summary
| Measurement | Immigrants from Denmark | Inupiat |
| Minimum | 19.3% | 1.9% |
| Maximum | 81.9% | 75.0% |
| Range | 62.5% | 73.1% |
| Mean | 49.9% | 22.0% |
| Median | 50.0% | 20.8% |
| Interquartile 25% (IQ1) | 42.1% | 7.3% |
| Interquartile 75% (IQ3) | 58.7% | 35.2% |
| Interquartile Range (IQR) | 16.6% | 27.9% |
| Standard Deviation (Sample) | 15.6% | 16.0% |
| Standard Deviation (Population) | 15.4% | 15.9% |
Similar Demographics by Associate's Degree
Demographics Similar to Immigrants from Denmark by Associate's Degree
In terms of associate's degree, the demographic groups most similar to Immigrants from Denmark are Immigrants from Russia (53.1%, a difference of 0.080%), Mongolian (53.0%, a difference of 0.16%), Russian (53.2%, a difference of 0.36%), Bulgarian (53.3%, a difference of 0.43%), and Immigrants from Belarus (52.8%, a difference of 0.45%).
| Demographics | Rating | Rank | Associate's Degree |
| Immigrants | Sri Lanka | 100.0 /100 | #30 | Exceptional 53.7% |
| Immigrants | Northern Europe | 100.0 /100 | #31 | Exceptional 53.5% |
| Immigrants | Turkey | 100.0 /100 | #32 | Exceptional 53.4% |
| Israelis | 100.0 /100 | #33 | Exceptional 53.4% |
| Bulgarians | 100.0 /100 | #34 | Exceptional 53.3% |
| Russians | 100.0 /100 | #35 | Exceptional 53.2% |
| Immigrants | Russia | 100.0 /100 | #36 | Exceptional 53.1% |
| Immigrants | Denmark | 100.0 /100 | #37 | Exceptional 53.1% |
| Mongolians | 100.0 /100 | #38 | Exceptional 53.0% |
| Immigrants | Belarus | 99.9 /100 | #39 | Exceptional 52.8% |
| Immigrants | Latvia | 99.9 /100 | #40 | Exceptional 52.8% |
| Immigrants | Saudi Arabia | 99.9 /100 | #41 | Exceptional 52.6% |
| Immigrants | Malaysia | 99.9 /100 | #42 | Exceptional 52.5% |
| Immigrants | South Africa | 99.9 /100 | #43 | Exceptional 52.5% |
| Estonians | 99.9 /100 | #44 | Exceptional 52.5% |
Demographics Similar to Inupiat by Associate's Degree
In terms of associate's degree, the demographic groups most similar to Inupiat are Navajo (32.6%, a difference of 0.050%), Yakama (32.3%, a difference of 0.77%), Tohono O'odham (31.8%, a difference of 2.5%), Immigrants from Mexico (33.7%, a difference of 3.6%), and Yuman (31.3%, a difference of 4.2%).
| Demographics | Rating | Rank | Associate's Degree |
| Mexicans | 0.0 /100 | #333 | Tragic 35.0% |
| Natives/Alaskans | 0.0 /100 | #334 | Tragic 34.9% |
| Spanish American Indians | 0.0 /100 | #335 | Tragic 34.9% |
| Hopi | 0.0 /100 | #336 | Tragic 34.6% |
| Lumbee | 0.0 /100 | #337 | Tragic 34.1% |
| Pueblo | 0.0 /100 | #338 | Tragic 34.0% |
| Immigrants | Mexico | 0.0 /100 | #339 | Tragic 33.7% |
| Navajo | 0.0 /100 | #340 | Tragic 32.6% |
| Inupiat | 0.0 /100 | #341 | Tragic 32.6% |
| Yakama | 0.0 /100 | #342 | Tragic 32.3% |
| Tohono O'odham | 0.0 /100 | #343 | Tragic 31.8% |
| Yuman | 0.0 /100 | #344 | Tragic 31.3% |
| Pima | 0.0 /100 | #345 | Tragic 30.2% |
| Houma | 0.0 /100 | #346 | Tragic 28.2% |
| Yup'ik | 0.0 /100 | #347 | Tragic 25.0% |