Immigrants from Guatemala vs Inupiat Associate's Degree
COMPARE
Immigrants from Guatemala
Inupiat
Associate's Degree
Associate's Degree Comparison
Immigrants from Guatemala
Inupiat
38.1%
ASSOCIATE'S DEGREE
0.0/ 100
METRIC RATING
309th/ 347
METRIC RANK
32.6%
ASSOCIATE'S DEGREE
0.0/ 100
METRIC RATING
341st/ 347
METRIC RANK
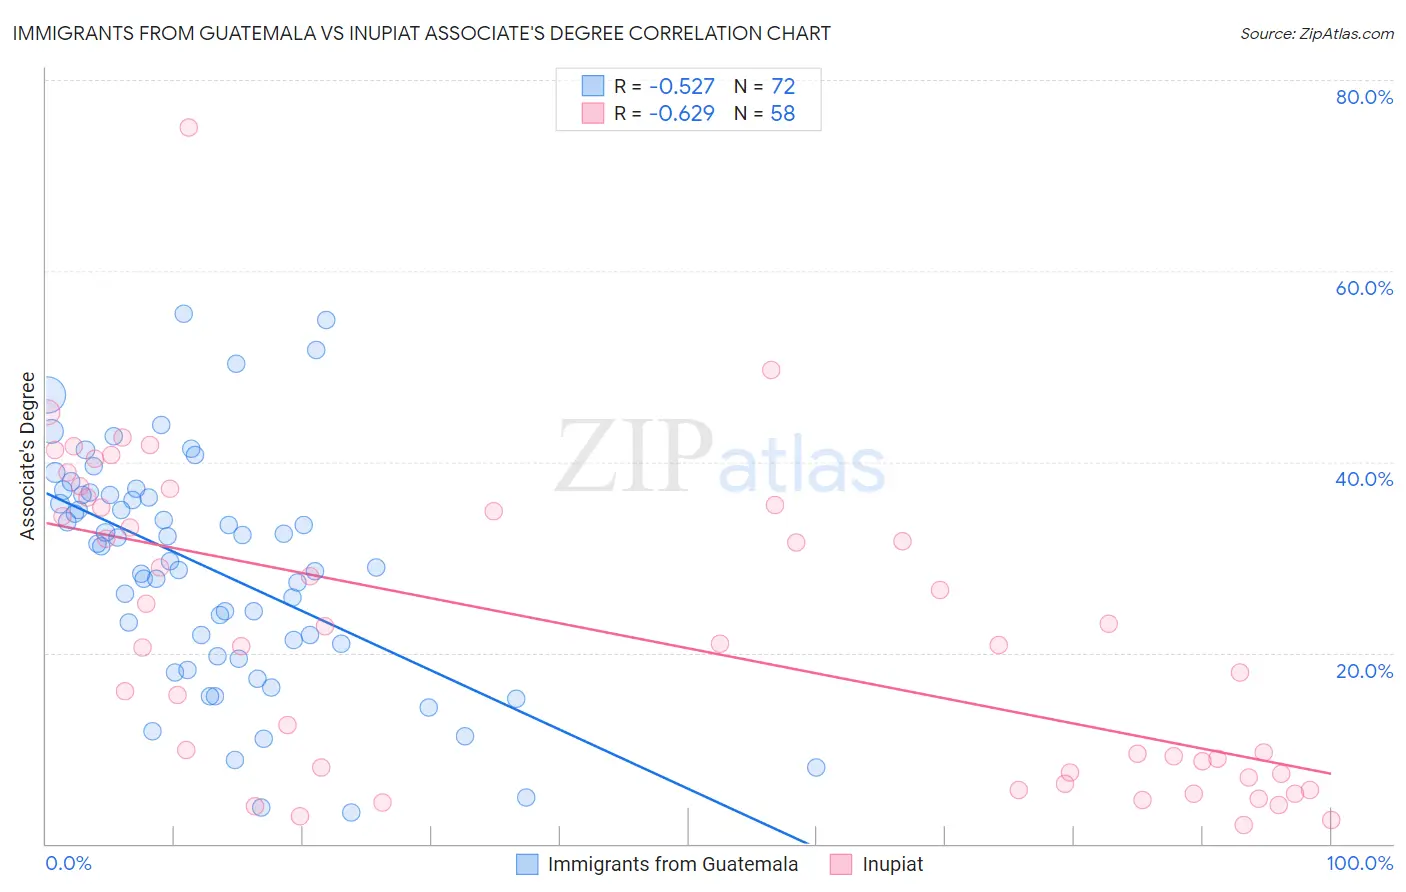
Immigrants from Guatemala vs Inupiat Associate's Degree Correlation Chart
The statistical analysis conducted on geographies consisting of 377,269,409 people shows a substantial negative correlation between the proportion of Immigrants from Guatemala and percentage of population with at least associate's degree education in the United States with a correlation coefficient (R) of -0.527 and weighted average of 38.1%. Similarly, the statistical analysis conducted on geographies consisting of 96,347,955 people shows a significant negative correlation between the proportion of Inupiat and percentage of population with at least associate's degree education in the United States with a correlation coefficient (R) of -0.629 and weighted average of 32.6%, a difference of 17.1%.
Associate's Degree Correlation Summary
| Measurement | Immigrants from Guatemala | Inupiat |
| Minimum | 3.3% | 1.9% |
| Maximum | 55.6% | 75.0% |
| Range | 52.2% | 73.1% |
| Mean | 28.9% | 22.0% |
| Median | 30.4% | 20.8% |
| Interquartile 25% (IQ1) | 20.3% | 7.3% |
| Interquartile 75% (IQ3) | 36.5% | 35.2% |
| Interquartile Range (IQR) | 16.2% | 27.9% |
| Standard Deviation (Sample) | 12.0% | 16.0% |
| Standard Deviation (Population) | 11.9% | 15.9% |
Similar Demographics by Associate's Degree
Demographics Similar to Immigrants from Guatemala by Associate's Degree
In terms of associate's degree, the demographic groups most similar to Immigrants from Guatemala are Mexican American Indian (38.2%, a difference of 0.040%), Immigrants from Dominican Republic (37.9%, a difference of 0.62%), Immigrants from El Salvador (38.4%, a difference of 0.71%), Immigrants from Latin America (37.9%, a difference of 0.73%), and Shoshone (38.4%, a difference of 0.75%).
| Demographics | Rating | Rank | Associate's Degree |
| Colville | 0.0 /100 | #302 | Tragic 38.5% |
| Guatemalans | 0.0 /100 | #303 | Tragic 38.5% |
| Sioux | 0.0 /100 | #304 | Tragic 38.5% |
| Immigrants | Honduras | 0.0 /100 | #305 | Tragic 38.5% |
| Shoshone | 0.0 /100 | #306 | Tragic 38.4% |
| Immigrants | El Salvador | 0.0 /100 | #307 | Tragic 38.4% |
| Mexican American Indians | 0.0 /100 | #308 | Tragic 38.2% |
| Immigrants | Guatemala | 0.0 /100 | #309 | Tragic 38.1% |
| Immigrants | Dominican Republic | 0.0 /100 | #310 | Tragic 37.9% |
| Immigrants | Latin America | 0.0 /100 | #311 | Tragic 37.9% |
| Choctaw | 0.0 /100 | #312 | Tragic 37.8% |
| Hispanics or Latinos | 0.0 /100 | #313 | Tragic 37.7% |
| Seminole | 0.0 /100 | #314 | Tragic 37.7% |
| Creek | 0.0 /100 | #315 | Tragic 37.6% |
| Crow | 0.0 /100 | #316 | Tragic 37.6% |
Demographics Similar to Inupiat by Associate's Degree
In terms of associate's degree, the demographic groups most similar to Inupiat are Navajo (32.6%, a difference of 0.050%), Yakama (32.3%, a difference of 0.77%), Tohono O'odham (31.8%, a difference of 2.5%), Immigrants from Mexico (33.7%, a difference of 3.6%), and Yuman (31.3%, a difference of 4.2%).
| Demographics | Rating | Rank | Associate's Degree |
| Mexicans | 0.0 /100 | #333 | Tragic 35.0% |
| Natives/Alaskans | 0.0 /100 | #334 | Tragic 34.9% |
| Spanish American Indians | 0.0 /100 | #335 | Tragic 34.9% |
| Hopi | 0.0 /100 | #336 | Tragic 34.6% |
| Lumbee | 0.0 /100 | #337 | Tragic 34.1% |
| Pueblo | 0.0 /100 | #338 | Tragic 34.0% |
| Immigrants | Mexico | 0.0 /100 | #339 | Tragic 33.7% |
| Navajo | 0.0 /100 | #340 | Tragic 32.6% |
| Inupiat | 0.0 /100 | #341 | Tragic 32.6% |
| Yakama | 0.0 /100 | #342 | Tragic 32.3% |
| Tohono O'odham | 0.0 /100 | #343 | Tragic 31.8% |
| Yuman | 0.0 /100 | #344 | Tragic 31.3% |
| Pima | 0.0 /100 | #345 | Tragic 30.2% |
| Houma | 0.0 /100 | #346 | Tragic 28.2% |
| Yup'ik | 0.0 /100 | #347 | Tragic 25.0% |