Immigrants from Iraq vs Inupiat Median Family Income
COMPARE
Immigrants from Iraq
Inupiat
Median Family Income
Median Family Income Comparison
Immigrants from Iraq
Inupiat
$98,786
MEDIAN FAMILY INCOME
12.1/ 100
METRIC RATING
206th/ 347
METRIC RANK
$91,730
MEDIAN FAMILY INCOME
0.4/ 100
METRIC RATING
261st/ 347
METRIC RANK
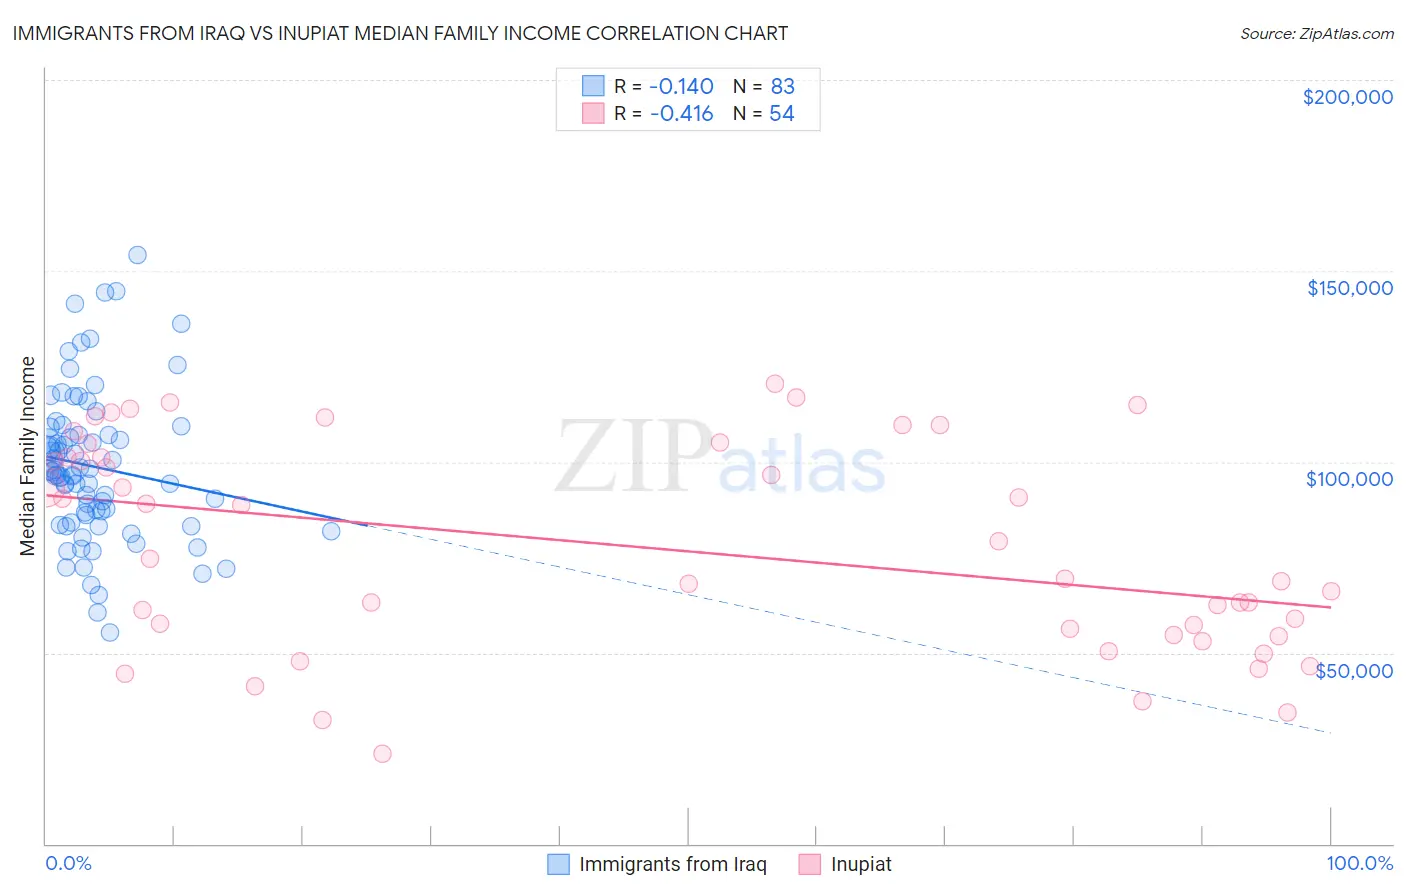
Immigrants from Iraq vs Inupiat Median Family Income Correlation Chart
The statistical analysis conducted on geographies consisting of 194,718,610 people shows a poor negative correlation between the proportion of Immigrants from Iraq and median family income in the United States with a correlation coefficient (R) of -0.140 and weighted average of $98,786. Similarly, the statistical analysis conducted on geographies consisting of 96,309,592 people shows a moderate negative correlation between the proportion of Inupiat and median family income in the United States with a correlation coefficient (R) of -0.416 and weighted average of $91,730, a difference of 7.7%.
Median Family Income Correlation Summary
| Measurement | Immigrants from Iraq | Inupiat |
| Minimum | $55,430 | $23,690 |
| Maximum | $154,107 | $120,501 |
| Range | $98,677 | $96,811 |
| Mean | $98,657 | $77,500 |
| Median | $96,637 | $72,103 |
| Interquartile 25% (IQ1) | $83,994 | $54,583 |
| Interquartile 75% (IQ3) | $108,953 | $101,242 |
| Interquartile Range (IQR) | $24,960 | $46,659 |
| Standard Deviation (Sample) | $19,813 | $27,340 |
| Standard Deviation (Population) | $19,693 | $27,086 |
Similar Demographics by Median Family Income
Demographics Similar to Immigrants from Iraq by Median Family Income
In terms of median family income, the demographic groups most similar to Immigrants from Iraq are Hawaiian ($98,869, a difference of 0.080%), Aleut ($98,702, a difference of 0.080%), Ghanaian ($98,877, a difference of 0.090%), Immigrants from Uruguay ($98,205, a difference of 0.59%), and Immigrants from Colombia ($98,067, a difference of 0.73%).
| Demographics | Rating | Rank | Median Family Income |
| Yugoslavians | 21.3 /100 | #199 | Fair $100,119 |
| Spanish | 20.1 /100 | #200 | Fair $99,977 |
| Immigrants | Thailand | 19.0 /100 | #201 | Poor $99,840 |
| Whites/Caucasians | 18.7 /100 | #202 | Poor $99,800 |
| Scotch-Irish | 17.1 /100 | #203 | Poor $99,591 |
| Ghanaians | 12.6 /100 | #204 | Poor $98,877 |
| Hawaiians | 12.5 /100 | #205 | Poor $98,869 |
| Immigrants | Iraq | 12.1 /100 | #206 | Poor $98,786 |
| Aleuts | 11.6 /100 | #207 | Poor $98,702 |
| Immigrants | Uruguay | 9.2 /100 | #208 | Tragic $98,205 |
| Immigrants | Colombia | 8.7 /100 | #209 | Tragic $98,067 |
| Puget Sound Salish | 8.2 /100 | #210 | Tragic $97,958 |
| Immigrants | Sudan | 7.4 /100 | #211 | Tragic $97,737 |
| Panamanians | 7.2 /100 | #212 | Tragic $97,683 |
| Immigrants | Armenia | 7.0 /100 | #213 | Tragic $97,605 |
Demographics Similar to Inupiat by Median Family Income
In terms of median family income, the demographic groups most similar to Inupiat are Liberian ($91,722, a difference of 0.010%), Pennsylvania German ($91,763, a difference of 0.040%), Cape Verdean ($91,848, a difference of 0.13%), Immigrants from West Indies ($91,588, a difference of 0.16%), and Osage ($91,926, a difference of 0.21%).
| Demographics | Rating | Rank | Median Family Income |
| Immigrants | Barbados | 0.5 /100 | #254 | Tragic $92,419 |
| Immigrants | Laos | 0.5 /100 | #255 | Tragic $92,239 |
| Nicaraguans | 0.5 /100 | #256 | Tragic $92,231 |
| Americans | 0.4 /100 | #257 | Tragic $92,096 |
| Osage | 0.4 /100 | #258 | Tragic $91,926 |
| Cape Verdeans | 0.4 /100 | #259 | Tragic $91,848 |
| Pennsylvania Germans | 0.4 /100 | #260 | Tragic $91,763 |
| Inupiat | 0.4 /100 | #261 | Tragic $91,730 |
| Liberians | 0.4 /100 | #262 | Tragic $91,722 |
| Immigrants | West Indies | 0.3 /100 | #263 | Tragic $91,588 |
| Senegalese | 0.3 /100 | #264 | Tragic $91,475 |
| Hmong | 0.3 /100 | #265 | Tragic $91,296 |
| Central Americans | 0.3 /100 | #266 | Tragic $91,087 |
| Mexican American Indians | 0.2 /100 | #267 | Tragic $90,918 |
| Cree | 0.2 /100 | #268 | Tragic $90,882 |