Immigrants from Guyana vs Uruguayan GED/Equivalency
COMPARE
Immigrants from Guyana
Uruguayan
GED/Equivalency
GED/Equivalency Comparison
Immigrants from Guyana
Uruguayans
81.0%
GED/EQUIVALENCY
0.0/ 100
METRIC RATING
310th/ 347
METRIC RANK
85.0%
GED/EQUIVALENCY
16.0/ 100
METRIC RATING
200th/ 347
METRIC RANK
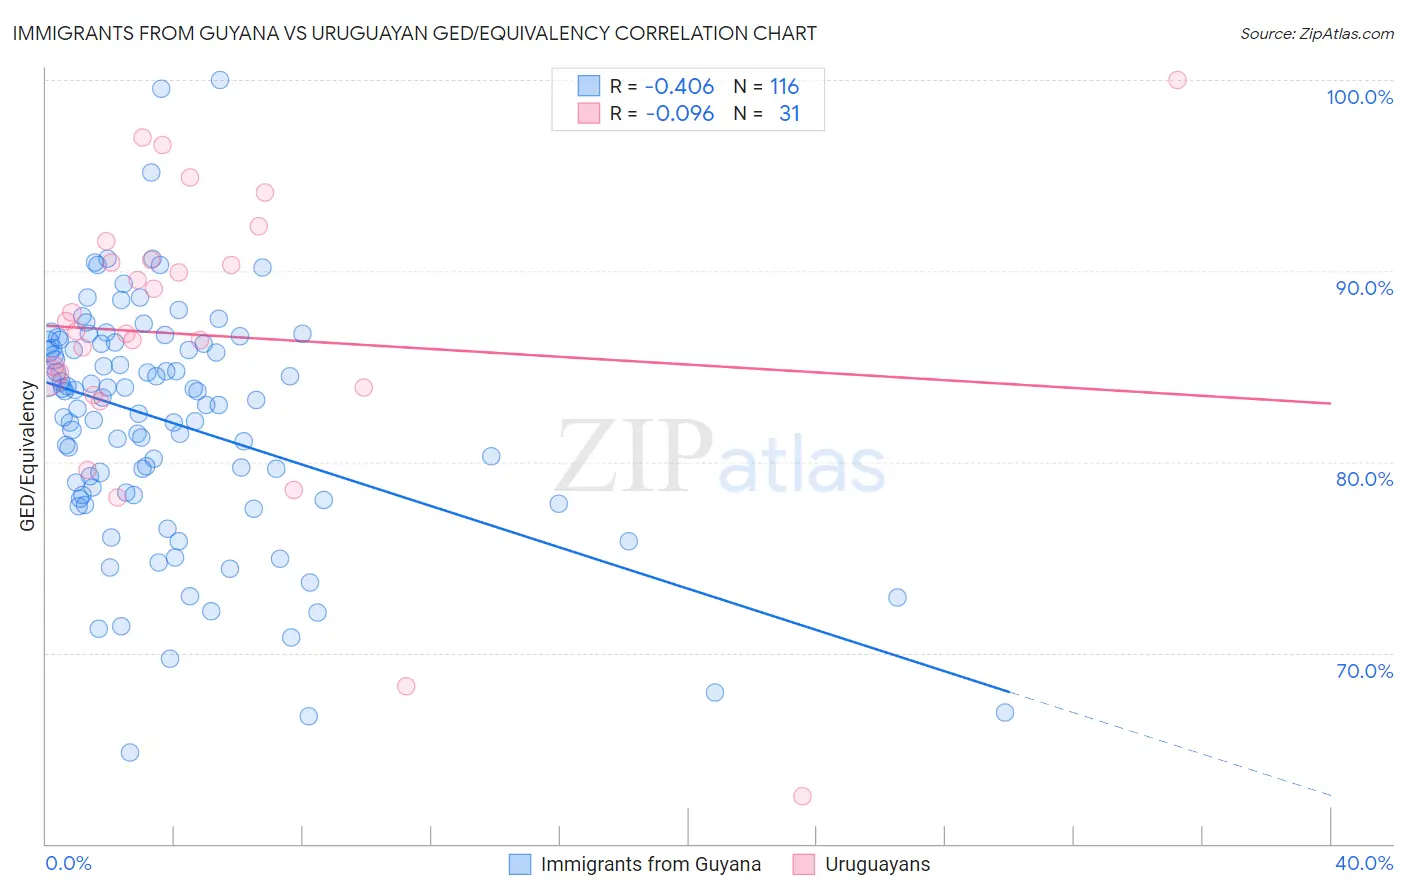
Immigrants from Guyana vs Uruguayan GED/Equivalency Correlation Chart
The statistical analysis conducted on geographies consisting of 183,746,342 people shows a moderate negative correlation between the proportion of Immigrants from Guyana and percentage of population with at least ged/equivalency education in the United States with a correlation coefficient (R) of -0.406 and weighted average of 81.0%. Similarly, the statistical analysis conducted on geographies consisting of 144,782,615 people shows a slight negative correlation between the proportion of Uruguayans and percentage of population with at least ged/equivalency education in the United States with a correlation coefficient (R) of -0.096 and weighted average of 85.0%, a difference of 5.0%.
GED/Equivalency Correlation Summary
| Measurement | Immigrants from Guyana | Uruguayan |
| Minimum | 64.8% | 62.5% |
| Maximum | 100.0% | 100.0% |
| Range | 35.2% | 37.5% |
| Mean | 82.0% | 86.6% |
| Median | 83.1% | 86.9% |
| Interquartile 25% (IQ1) | 78.3% | 83.9% |
| Interquartile 75% (IQ3) | 86.2% | 90.5% |
| Interquartile Range (IQR) | 7.9% | 6.7% |
| Standard Deviation (Sample) | 6.3% | 7.7% |
| Standard Deviation (Population) | 6.2% | 7.6% |
Similar Demographics by GED/Equivalency
Demographics Similar to Immigrants from Guyana by GED/Equivalency
In terms of ged/equivalency, the demographic groups most similar to Immigrants from Guyana are Native/Alaskan (80.9%, a difference of 0.0%), Nicaraguan (80.9%, a difference of 0.040%), Cape Verdean (80.9%, a difference of 0.040%), Immigrants from Ecuador (81.0%, a difference of 0.060%), and Belizean (80.9%, a difference of 0.060%).
| Demographics | Rating | Rank | GED/Equivalency |
| Immigrants | Portugal | 0.0 /100 | #303 | Tragic 81.6% |
| Navajo | 0.0 /100 | #304 | Tragic 81.5% |
| Immigrants | Grenada | 0.0 /100 | #305 | Tragic 81.3% |
| Guyanese | 0.0 /100 | #306 | Tragic 81.3% |
| Immigrants | Dominica | 0.0 /100 | #307 | Tragic 81.1% |
| Puerto Ricans | 0.0 /100 | #308 | Tragic 81.1% |
| Immigrants | Ecuador | 0.0 /100 | #309 | Tragic 81.0% |
| Immigrants | Guyana | 0.0 /100 | #310 | Tragic 81.0% |
| Natives/Alaskans | 0.0 /100 | #311 | Tragic 80.9% |
| Nicaraguans | 0.0 /100 | #312 | Tragic 80.9% |
| Cape Verdeans | 0.0 /100 | #313 | Tragic 80.9% |
| Belizeans | 0.0 /100 | #314 | Tragic 80.9% |
| Apache | 0.0 /100 | #315 | Tragic 80.7% |
| Central American Indians | 0.0 /100 | #316 | Tragic 80.6% |
| Immigrants | Caribbean | 0.0 /100 | #317 | Tragic 80.5% |
Demographics Similar to Uruguayans by GED/Equivalency
In terms of ged/equivalency, the demographic groups most similar to Uruguayans are Portuguese (85.0%, a difference of 0.0%), Somali (85.0%, a difference of 0.010%), Cree (85.0%, a difference of 0.010%), Panamanian (85.0%, a difference of 0.030%), and Hawaiian (85.0%, a difference of 0.030%).
| Demographics | Rating | Rank | GED/Equivalency |
| Delaware | 22.2 /100 | #193 | Fair 85.2% |
| Puget Sound Salish | 20.8 /100 | #194 | Fair 85.2% |
| Chippewa | 20.8 /100 | #195 | Fair 85.2% |
| Tongans | 20.7 /100 | #196 | Fair 85.2% |
| Costa Ricans | 20.4 /100 | #197 | Fair 85.2% |
| Immigrants | Africa | 17.5 /100 | #198 | Poor 85.1% |
| Somalis | 16.4 /100 | #199 | Poor 85.0% |
| Uruguayans | 16.0 /100 | #200 | Poor 85.0% |
| Portuguese | 15.9 /100 | #201 | Poor 85.0% |
| Cree | 15.9 /100 | #202 | Poor 85.0% |
| Panamanians | 15.3 /100 | #203 | Poor 85.0% |
| Hawaiians | 15.2 /100 | #204 | Poor 85.0% |
| Liberians | 14.6 /100 | #205 | Poor 85.0% |
| Samoans | 13.7 /100 | #206 | Poor 84.9% |
| Hmong | 13.1 /100 | #207 | Poor 84.9% |