Korean vs Uruguayan GED/Equivalency
COMPARE
Korean
Uruguayan
GED/Equivalency
GED/Equivalency Comparison
Koreans
Uruguayans
85.6%
GED/EQUIVALENCY
41.2/ 100
METRIC RATING
178th/ 347
METRIC RANK
85.0%
GED/EQUIVALENCY
16.0/ 100
METRIC RATING
200th/ 347
METRIC RANK
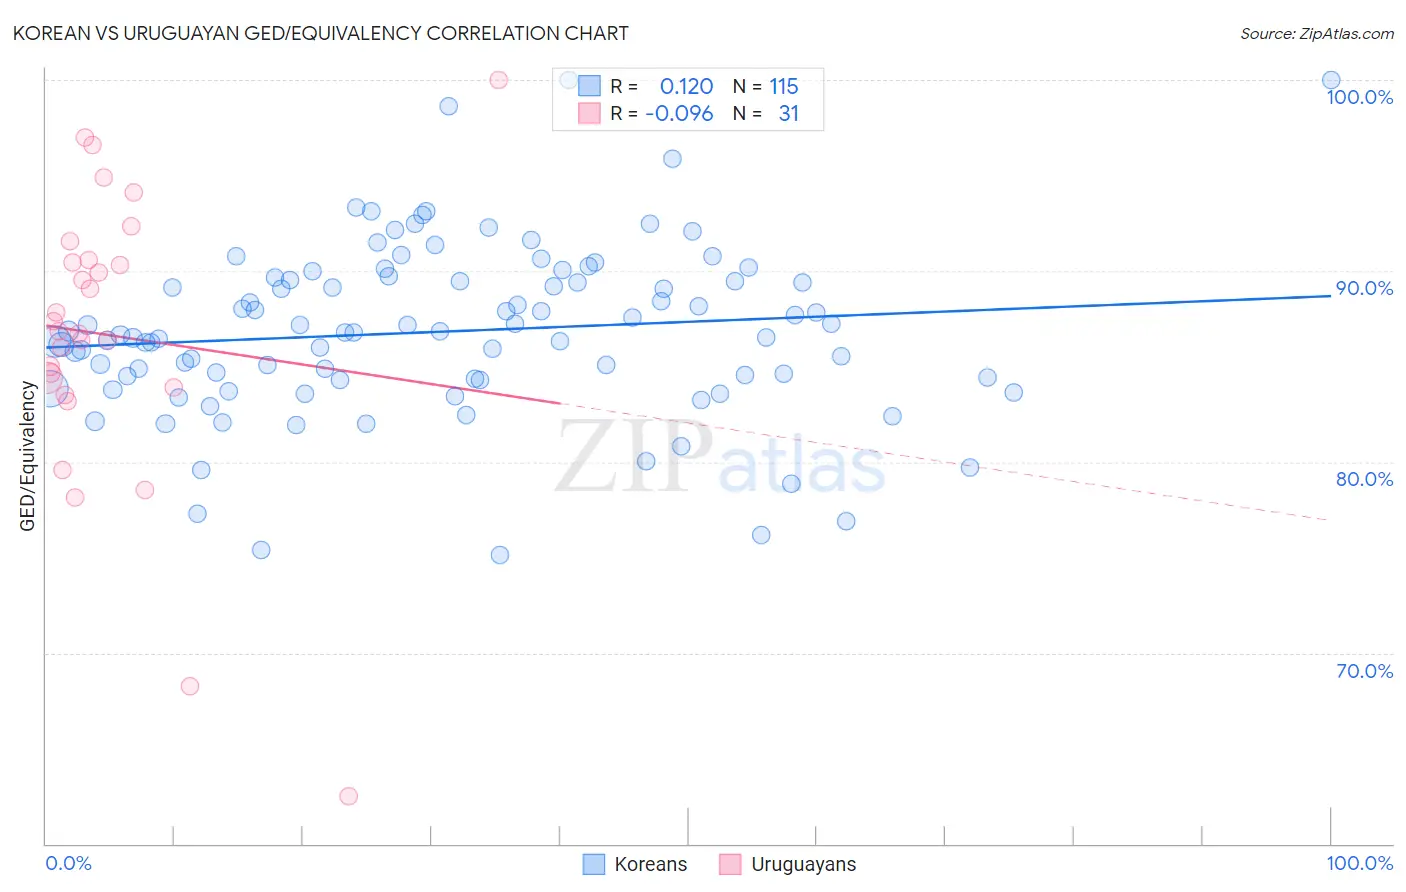
Korean vs Uruguayan GED/Equivalency Correlation Chart
The statistical analysis conducted on geographies consisting of 510,944,156 people shows a poor positive correlation between the proportion of Koreans and percentage of population with at least ged/equivalency education in the United States with a correlation coefficient (R) of 0.120 and weighted average of 85.6%. Similarly, the statistical analysis conducted on geographies consisting of 144,782,615 people shows a slight negative correlation between the proportion of Uruguayans and percentage of population with at least ged/equivalency education in the United States with a correlation coefficient (R) of -0.096 and weighted average of 85.0%, a difference of 0.68%.
GED/Equivalency Correlation Summary
| Measurement | Korean | Uruguayan |
| Minimum | 75.1% | 62.5% |
| Maximum | 100.0% | 100.0% |
| Range | 24.9% | 37.5% |
| Mean | 86.8% | 86.6% |
| Median | 86.8% | 86.9% |
| Interquartile 25% (IQ1) | 84.3% | 83.9% |
| Interquartile 75% (IQ3) | 89.5% | 90.5% |
| Interquartile Range (IQR) | 5.2% | 6.7% |
| Standard Deviation (Sample) | 4.5% | 7.7% |
| Standard Deviation (Population) | 4.5% | 7.6% |
Similar Demographics by GED/Equivalency
Demographics Similar to Koreans by GED/Equivalency
In terms of ged/equivalency, the demographic groups most similar to Koreans are Aleut (85.6%, a difference of 0.020%), Immigrants from Southern Europe (85.5%, a difference of 0.060%), Immigrants from Uganda (85.7%, a difference of 0.080%), Moroccan (85.5%, a difference of 0.080%), and Immigrants from Eastern Africa (85.7%, a difference of 0.13%).
| Demographics | Rating | Rank | GED/Equivalency |
| Immigrants | Chile | 57.3 /100 | #171 | Average 85.9% |
| Bermudans | 55.1 /100 | #172 | Average 85.8% |
| Immigrants | Venezuela | 50.7 /100 | #173 | Average 85.8% |
| Ottawa | 50.0 /100 | #174 | Average 85.8% |
| Immigrants | Bolivia | 49.8 /100 | #175 | Average 85.8% |
| Immigrants | Eastern Africa | 47.7 /100 | #176 | Average 85.7% |
| Immigrants | Uganda | 45.2 /100 | #177 | Average 85.7% |
| Koreans | 41.2 /100 | #178 | Average 85.6% |
| Aleuts | 40.5 /100 | #179 | Average 85.6% |
| Immigrants | Southern Europe | 38.4 /100 | #180 | Fair 85.5% |
| Moroccans | 37.7 /100 | #181 | Fair 85.5% |
| Sudanese | 35.2 /100 | #182 | Fair 85.5% |
| Immigrants | Sudan | 34.2 /100 | #183 | Fair 85.5% |
| Immigrants | Oceania | 33.6 /100 | #184 | Fair 85.5% |
| Spanish | 32.8 /100 | #185 | Fair 85.4% |
Demographics Similar to Uruguayans by GED/Equivalency
In terms of ged/equivalency, the demographic groups most similar to Uruguayans are Portuguese (85.0%, a difference of 0.0%), Somali (85.0%, a difference of 0.010%), Cree (85.0%, a difference of 0.010%), Panamanian (85.0%, a difference of 0.030%), and Hawaiian (85.0%, a difference of 0.030%).
| Demographics | Rating | Rank | GED/Equivalency |
| Delaware | 22.2 /100 | #193 | Fair 85.2% |
| Puget Sound Salish | 20.8 /100 | #194 | Fair 85.2% |
| Chippewa | 20.8 /100 | #195 | Fair 85.2% |
| Tongans | 20.7 /100 | #196 | Fair 85.2% |
| Costa Ricans | 20.4 /100 | #197 | Fair 85.2% |
| Immigrants | Africa | 17.5 /100 | #198 | Poor 85.1% |
| Somalis | 16.4 /100 | #199 | Poor 85.0% |
| Uruguayans | 16.0 /100 | #200 | Poor 85.0% |
| Portuguese | 15.9 /100 | #201 | Poor 85.0% |
| Cree | 15.9 /100 | #202 | Poor 85.0% |
| Panamanians | 15.3 /100 | #203 | Poor 85.0% |
| Hawaiians | 15.2 /100 | #204 | Poor 85.0% |
| Liberians | 14.6 /100 | #205 | Poor 85.0% |
| Samoans | 13.7 /100 | #206 | Poor 84.9% |
| Hmong | 13.1 /100 | #207 | Poor 84.9% |