Immigrants from Guyana vs Uruguayan Female Unemployment
COMPARE
Immigrants from Guyana
Uruguayan
Female Unemployment
Female Unemployment Comparison
Immigrants from Guyana
Uruguayans
6.7%
FEMALE UNEMPLOYMENT
0.0/ 100
METRIC RATING
329th/ 347
METRIC RANK
5.4%
FEMALE UNEMPLOYMENT
11.4/ 100
METRIC RATING
212th/ 347
METRIC RANK
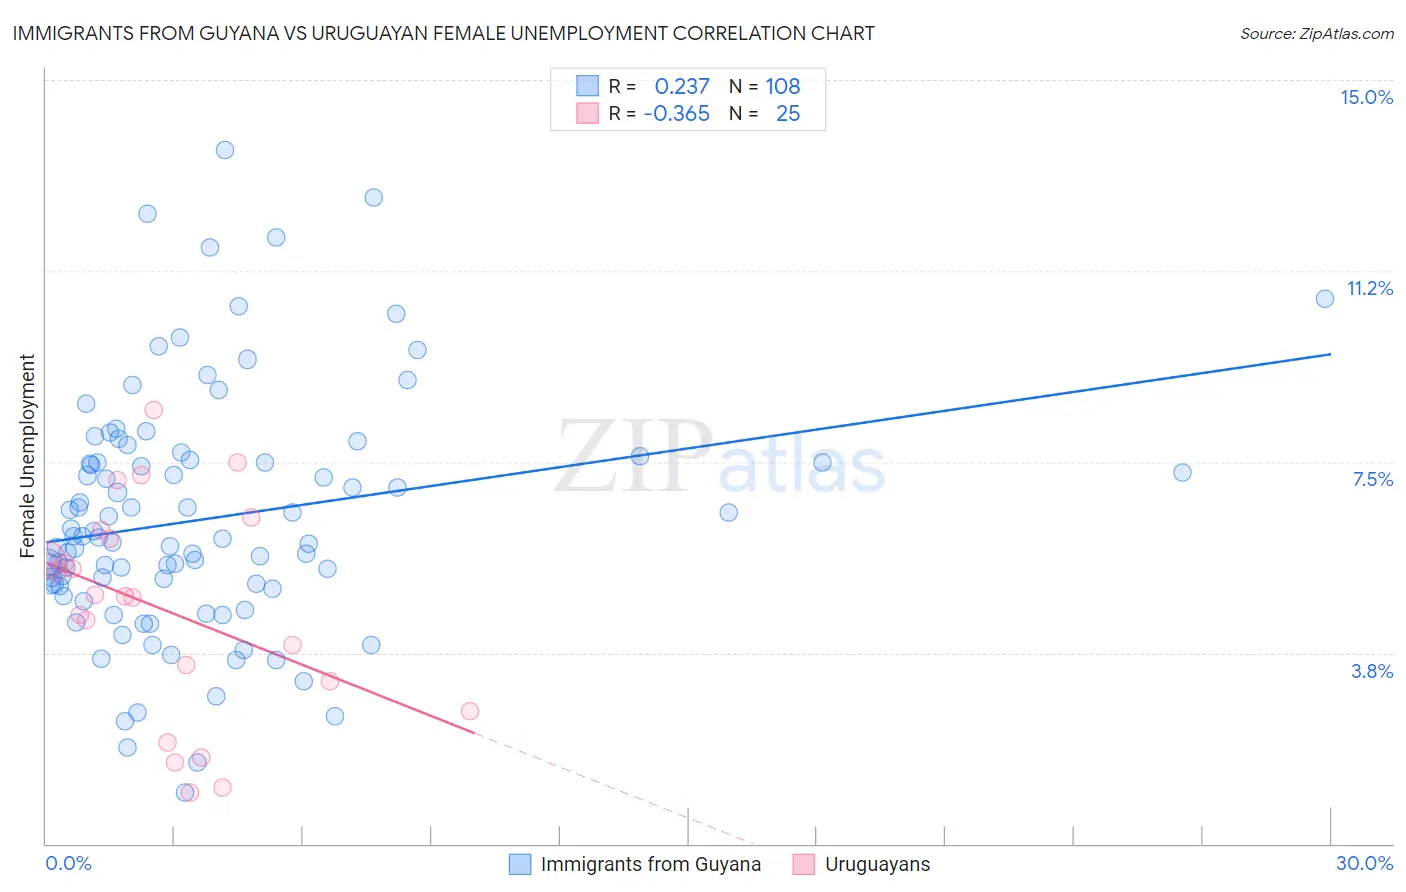
Immigrants from Guyana vs Uruguayan Female Unemployment Correlation Chart
The statistical analysis conducted on geographies consisting of 183,445,412 people shows a weak positive correlation between the proportion of Immigrants from Guyana and unemploymnet rate among females in the United States with a correlation coefficient (R) of 0.237 and weighted average of 6.7%. Similarly, the statistical analysis conducted on geographies consisting of 144,657,332 people shows a mild negative correlation between the proportion of Uruguayans and unemploymnet rate among females in the United States with a correlation coefficient (R) of -0.365 and weighted average of 5.4%, a difference of 23.4%.
Female Unemployment Correlation Summary
| Measurement | Immigrants from Guyana | Uruguayan |
| Minimum | 1.0% | 1.0% |
| Maximum | 13.6% | 8.5% |
| Range | 12.6% | 7.5% |
| Mean | 6.4% | 4.6% |
| Median | 6.0% | 4.9% |
| Interquartile 25% (IQ1) | 5.1% | 2.9% |
| Interquartile 75% (IQ3) | 7.5% | 6.1% |
| Interquartile Range (IQR) | 2.4% | 3.2% |
| Standard Deviation (Sample) | 2.4% | 2.1% |
| Standard Deviation (Population) | 2.4% | 2.0% |
Similar Demographics by Female Unemployment
Demographics Similar to Immigrants from Guyana by Female Unemployment
In terms of female unemployment, the demographic groups most similar to Immigrants from Guyana are Guyanese (6.7%, a difference of 0.37%), Yakama (6.7%, a difference of 0.57%), Alaska Native (6.6%, a difference of 0.80%), Native/Alaskan (6.6%, a difference of 0.89%), and Apache (6.6%, a difference of 1.5%).
| Demographics | Rating | Rank | Female Unemployment |
| Vietnamese | 0.0 /100 | #322 | Tragic 6.5% |
| Immigrants | Belize | 0.0 /100 | #323 | Tragic 6.5% |
| Cheyenne | 0.0 /100 | #324 | Tragic 6.6% |
| Apache | 0.0 /100 | #325 | Tragic 6.6% |
| Natives/Alaskans | 0.0 /100 | #326 | Tragic 6.6% |
| Alaska Natives | 0.0 /100 | #327 | Tragic 6.6% |
| Guyanese | 0.0 /100 | #328 | Tragic 6.7% |
| Immigrants | Guyana | 0.0 /100 | #329 | Tragic 6.7% |
| Yakama | 0.0 /100 | #330 | Tragic 6.7% |
| Paiute | 0.0 /100 | #331 | Tragic 6.8% |
| Sioux | 0.0 /100 | #332 | Tragic 7.0% |
| Menominee | 0.0 /100 | #333 | Tragic 7.0% |
| Immigrants | Armenia | 0.0 /100 | #334 | Tragic 7.1% |
| Dominicans | 0.0 /100 | #335 | Tragic 7.2% |
| Immigrants | Dominican Republic | 0.0 /100 | #336 | Tragic 7.2% |
Demographics Similar to Uruguayans by Female Unemployment
In terms of female unemployment, the demographic groups most similar to Uruguayans are Ottawa (5.4%, a difference of 0.020%), Choctaw (5.4%, a difference of 0.12%), Samoan (5.4%, a difference of 0.12%), Seminole (5.4%, a difference of 0.17%), and Immigrants from Nicaragua (5.4%, a difference of 0.19%).
| Demographics | Rating | Rank | Female Unemployment |
| Immigrants | Afghanistan | 18.9 /100 | #205 | Poor 5.4% |
| Immigrants | Brazil | 18.8 /100 | #206 | Poor 5.4% |
| Creek | 15.4 /100 | #207 | Poor 5.4% |
| Immigrants | Costa Rica | 13.7 /100 | #208 | Poor 5.4% |
| Koreans | 13.4 /100 | #209 | Poor 5.4% |
| Choctaw | 12.3 /100 | #210 | Poor 5.4% |
| Ottawa | 11.6 /100 | #211 | Poor 5.4% |
| Uruguayans | 11.4 /100 | #212 | Poor 5.4% |
| Samoans | 10.6 /100 | #213 | Poor 5.4% |
| Seminole | 10.3 /100 | #214 | Poor 5.4% |
| Immigrants | Nicaragua | 10.2 /100 | #215 | Poor 5.4% |
| Comanche | 10.0 /100 | #216 | Poor 5.4% |
| Peruvians | 9.6 /100 | #217 | Tragic 5.4% |
| Bermudans | 9.0 /100 | #218 | Tragic 5.4% |
| South Americans | 8.6 /100 | #219 | Tragic 5.4% |