Immigrants from Guyana vs Subsaharan African GED/Equivalency
COMPARE
Immigrants from Guyana
Subsaharan African
GED/Equivalency
GED/Equivalency Comparison
Immigrants from Guyana
Sub-Saharan Africans
81.0%
GED/EQUIVALENCY
0.0/ 100
METRIC RATING
310th/ 347
METRIC RANK
84.2%
GED/EQUIVALENCY
3.0/ 100
METRIC RATING
237th/ 347
METRIC RANK
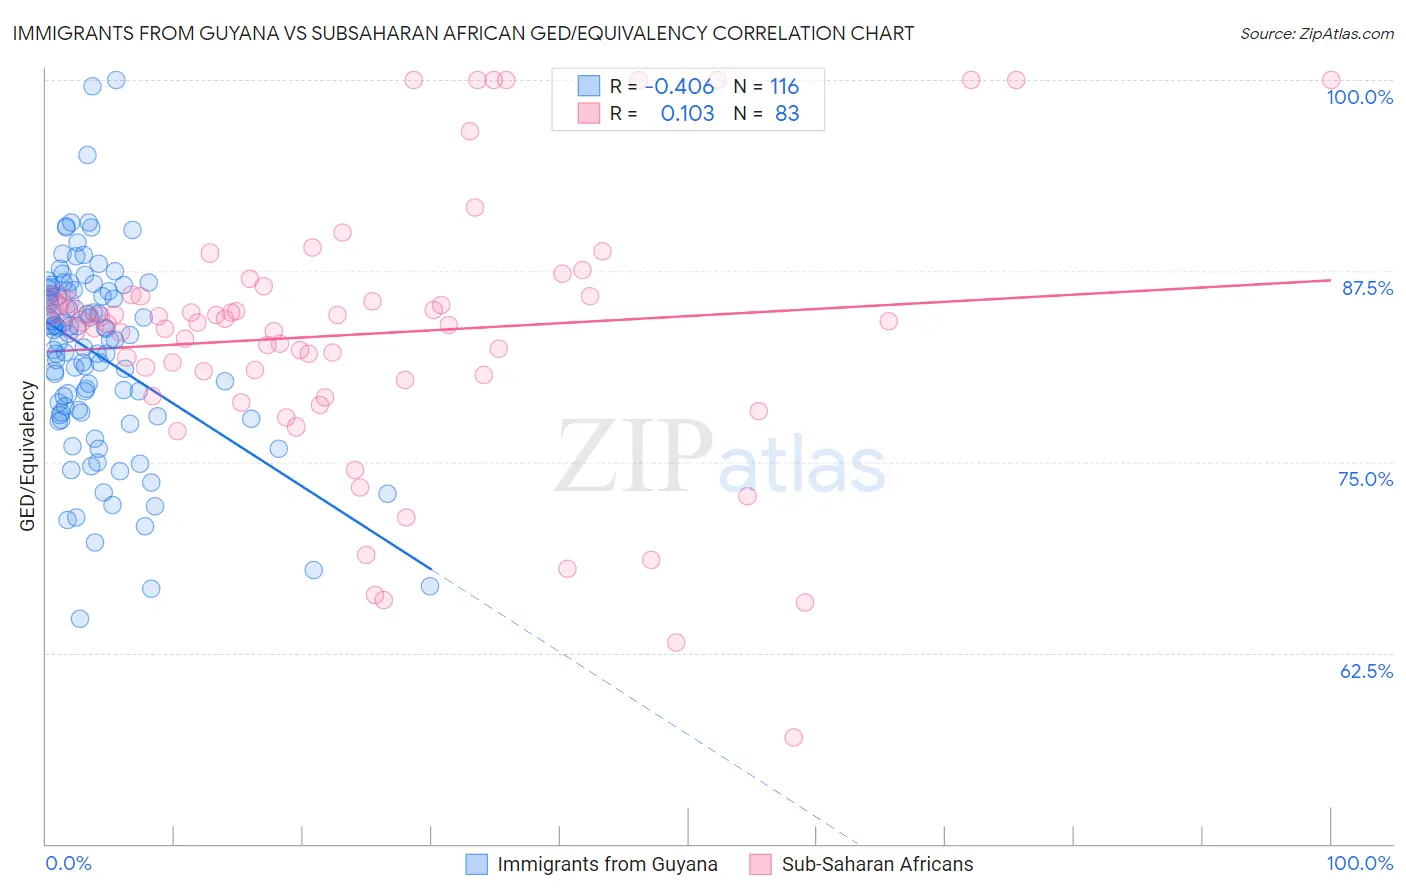
Immigrants from Guyana vs Subsaharan African GED/Equivalency Correlation Chart
The statistical analysis conducted on geographies consisting of 183,746,342 people shows a moderate negative correlation between the proportion of Immigrants from Guyana and percentage of population with at least ged/equivalency education in the United States with a correlation coefficient (R) of -0.406 and weighted average of 81.0%. Similarly, the statistical analysis conducted on geographies consisting of 508,215,958 people shows a poor positive correlation between the proportion of Sub-Saharan Africans and percentage of population with at least ged/equivalency education in the United States with a correlation coefficient (R) of 0.103 and weighted average of 84.2%, a difference of 4.1%.
GED/Equivalency Correlation Summary
| Measurement | Immigrants from Guyana | Subsaharan African |
| Minimum | 64.8% | 56.9% |
| Maximum | 100.0% | 100.0% |
| Range | 35.2% | 43.1% |
| Mean | 82.0% | 83.4% |
| Median | 83.1% | 84.2% |
| Interquartile 25% (IQ1) | 78.3% | 80.4% |
| Interquartile 75% (IQ3) | 86.2% | 85.9% |
| Interquartile Range (IQR) | 7.9% | 5.5% |
| Standard Deviation (Sample) | 6.3% | 8.8% |
| Standard Deviation (Population) | 6.2% | 8.7% |
Similar Demographics by GED/Equivalency
Demographics Similar to Immigrants from Guyana by GED/Equivalency
In terms of ged/equivalency, the demographic groups most similar to Immigrants from Guyana are Native/Alaskan (80.9%, a difference of 0.0%), Nicaraguan (80.9%, a difference of 0.040%), Cape Verdean (80.9%, a difference of 0.040%), Immigrants from Ecuador (81.0%, a difference of 0.060%), and Belizean (80.9%, a difference of 0.060%).
| Demographics | Rating | Rank | GED/Equivalency |
| Immigrants | Portugal | 0.0 /100 | #303 | Tragic 81.6% |
| Navajo | 0.0 /100 | #304 | Tragic 81.5% |
| Immigrants | Grenada | 0.0 /100 | #305 | Tragic 81.3% |
| Guyanese | 0.0 /100 | #306 | Tragic 81.3% |
| Immigrants | Dominica | 0.0 /100 | #307 | Tragic 81.1% |
| Puerto Ricans | 0.0 /100 | #308 | Tragic 81.1% |
| Immigrants | Ecuador | 0.0 /100 | #309 | Tragic 81.0% |
| Immigrants | Guyana | 0.0 /100 | #310 | Tragic 81.0% |
| Natives/Alaskans | 0.0 /100 | #311 | Tragic 80.9% |
| Nicaraguans | 0.0 /100 | #312 | Tragic 80.9% |
| Cape Verdeans | 0.0 /100 | #313 | Tragic 80.9% |
| Belizeans | 0.0 /100 | #314 | Tragic 80.9% |
| Apache | 0.0 /100 | #315 | Tragic 80.7% |
| Central American Indians | 0.0 /100 | #316 | Tragic 80.6% |
| Immigrants | Caribbean | 0.0 /100 | #317 | Tragic 80.5% |
Demographics Similar to Sub-Saharan Africans by GED/Equivalency
In terms of ged/equivalency, the demographic groups most similar to Sub-Saharan Africans are Immigrants from Peru (84.2%, a difference of 0.060%), Ghanaian (84.3%, a difference of 0.070%), Immigrants from Eritrea (84.3%, a difference of 0.070%), Immigrants from Bahamas (84.2%, a difference of 0.090%), and Immigrants from Nigeria (84.3%, a difference of 0.10%).
| Demographics | Rating | Rank | GED/Equivalency |
| Immigrants | Colombia | 4.5 /100 | #230 | Tragic 84.4% |
| Immigrants | Middle Africa | 4.3 /100 | #231 | Tragic 84.4% |
| Immigrants | South America | 4.2 /100 | #232 | Tragic 84.4% |
| Immigrants | Panama | 4.1 /100 | #233 | Tragic 84.4% |
| Immigrants | Nigeria | 3.6 /100 | #234 | Tragic 84.3% |
| Ghanaians | 3.5 /100 | #235 | Tragic 84.3% |
| Immigrants | Eritrea | 3.5 /100 | #236 | Tragic 84.3% |
| Sub-Saharan Africans | 3.0 /100 | #237 | Tragic 84.2% |
| Immigrants | Peru | 2.7 /100 | #238 | Tragic 84.2% |
| Immigrants | Bahamas | 2.6 /100 | #239 | Tragic 84.2% |
| Immigrants | South Eastern Asia | 2.5 /100 | #240 | Tragic 84.1% |
| Senegalese | 1.9 /100 | #241 | Tragic 84.0% |
| Sri Lankans | 1.9 /100 | #242 | Tragic 84.0% |
| Cherokee | 1.3 /100 | #243 | Tragic 83.9% |
| Immigrants | Ghana | 1.3 /100 | #244 | Tragic 83.9% |