Immigrants from Guyana vs Uruguayan Median Household Income
COMPARE
Immigrants from Guyana
Uruguayan
Median Household Income
Median Household Income Comparison
Immigrants from Guyana
Uruguayans
$80,324
MEDIAN HOUSEHOLD INCOME
4.5/ 100
METRIC RATING
235th/ 347
METRIC RANK
$84,691
MEDIAN HOUSEHOLD INCOME
43.5/ 100
METRIC RATING
182nd/ 347
METRIC RANK
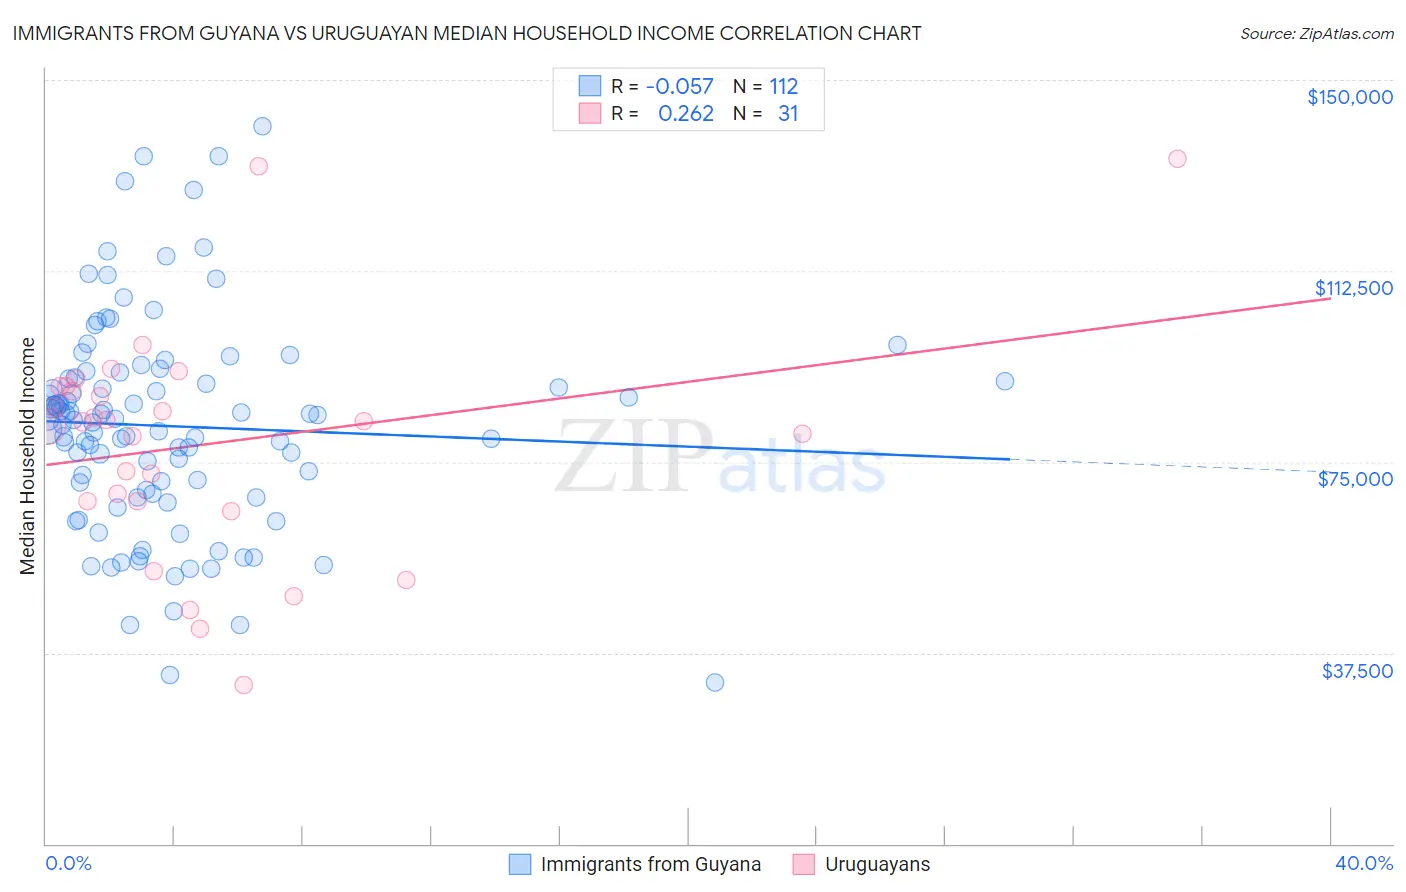
Immigrants from Guyana vs Uruguayan Median Household Income Correlation Chart
The statistical analysis conducted on geographies consisting of 183,660,864 people shows a slight negative correlation between the proportion of Immigrants from Guyana and median household income in the United States with a correlation coefficient (R) of -0.057 and weighted average of $80,324. Similarly, the statistical analysis conducted on geographies consisting of 144,748,959 people shows a weak positive correlation between the proportion of Uruguayans and median household income in the United States with a correlation coefficient (R) of 0.262 and weighted average of $84,691, a difference of 5.4%.
Median Household Income Correlation Summary
| Measurement | Immigrants from Guyana | Uruguayan |
| Minimum | $31,571 | $31,250 |
| Maximum | $140,893 | $134,635 |
| Range | $109,322 | $103,385 |
| Mean | $81,995 | $78,489 |
| Median | $83,283 | $82,857 |
| Interquartile 25% (IQ1) | $69,032 | $67,190 |
| Interquartile 75% (IQ3) | $91,451 | $89,740 |
| Interquartile Range (IQR) | $22,418 | $22,550 |
| Standard Deviation (Sample) | $20,739 | $22,490 |
| Standard Deviation (Population) | $20,646 | $22,125 |
Similar Demographics by Median Household Income
Demographics Similar to Immigrants from Guyana by Median Household Income
In terms of median household income, the demographic groups most similar to Immigrants from Guyana are Immigrants from Ecuador ($80,341, a difference of 0.020%), Immigrants from the Azores ($80,357, a difference of 0.040%), Immigrants from Trinidad and Tobago ($80,373, a difference of 0.060%), Bermudan ($80,406, a difference of 0.10%), and Trinidadian and Tobagonian ($80,402, a difference of 0.10%).
| Demographics | Rating | Rank | Median Household Income |
| Immigrants | Bangladesh | 5.7 /100 | #228 | Tragic $80,722 |
| Delaware | 5.0 /100 | #229 | Tragic $80,527 |
| Bermudans | 4.7 /100 | #230 | Tragic $80,406 |
| Trinidadians and Tobagonians | 4.7 /100 | #231 | Tragic $80,402 |
| Immigrants | Trinidad and Tobago | 4.6 /100 | #232 | Tragic $80,373 |
| Immigrants | Azores | 4.5 /100 | #233 | Tragic $80,357 |
| Immigrants | Ecuador | 4.5 /100 | #234 | Tragic $80,341 |
| Immigrants | Guyana | 4.5 /100 | #235 | Tragic $80,324 |
| Immigrants | Bosnia and Herzegovina | 3.4 /100 | #236 | Tragic $79,888 |
| Nicaraguans | 3.1 /100 | #237 | Tragic $79,737 |
| Barbadians | 3.0 /100 | #238 | Tragic $79,664 |
| Alaska Natives | 2.7 /100 | #239 | Tragic $79,509 |
| Immigrants | Western Africa | 2.7 /100 | #240 | Tragic $79,490 |
| Immigrants | Nonimmigrants | 2.6 /100 | #241 | Tragic $79,429 |
| Immigrants | Sudan | 2.1 /100 | #242 | Tragic $79,103 |
Demographics Similar to Uruguayans by Median Household Income
In terms of median household income, the demographic groups most similar to Uruguayans are Hawaiian ($84,729, a difference of 0.040%), Immigrants from Portugal ($84,740, a difference of 0.060%), Spaniard ($84,644, a difference of 0.060%), English ($84,915, a difference of 0.26%), and Czechoslovakian ($84,965, a difference of 0.32%).
| Demographics | Rating | Rank | Median Household Income |
| Immigrants | Costa Rica | 49.2 /100 | #175 | Average $85,054 |
| Alsatians | 49.2 /100 | #176 | Average $85,053 |
| Immigrants | Eritrea | 48.8 /100 | #177 | Average $85,025 |
| Czechoslovakians | 47.8 /100 | #178 | Average $84,965 |
| English | 47.0 /100 | #179 | Average $84,915 |
| Immigrants | Portugal | 44.2 /100 | #180 | Average $84,740 |
| Hawaiians | 44.1 /100 | #181 | Average $84,729 |
| Uruguayans | 43.5 /100 | #182 | Average $84,691 |
| Spaniards | 42.7 /100 | #183 | Average $84,644 |
| Immigrants | Eastern Africa | 37.4 /100 | #184 | Fair $84,299 |
| Kenyans | 34.2 /100 | #185 | Fair $84,085 |
| Puget Sound Salish | 33.2 /100 | #186 | Fair $84,011 |
| Belgians | 33.2 /100 | #187 | Fair $84,008 |
| Tlingit-Haida | 32.6 /100 | #188 | Fair $83,968 |
| Immigrants | Colombia | 31.7 /100 | #189 | Fair $83,902 |